
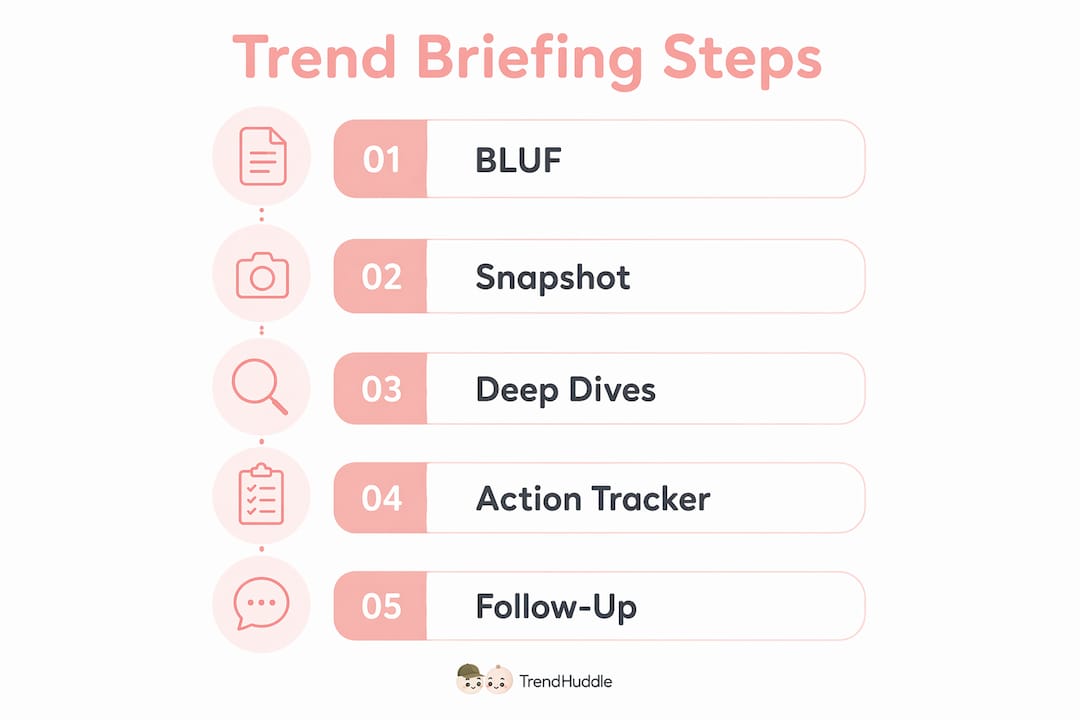
A well-structured trend briefing follows one repeatable pattern: a three-line executive BLUF, a compact market snapshot table, two or three prioritised deep dives, a strategic implications block, and an action tracker with named owners and deadlines. That sequence takes under a minute to scan and maps directly to the decisions a leadership team needs to make in a weekly sync or monthly operating review. Every element earns its place by answering a specific question: the BLUF answers "what matters now?", the snapshot answers "how big and how fast?", the deep dives answer "why and so what?", the implications block answers "what should we change?", and the action tracker answers "who does what by when?"
- Executive summary (BLUF): 30–60 words, decision-facing. Readable in under 60 seconds.
- Market snapshot: core metrics table covering trend label, stage, momentum score, confidence, and priority.
- Deep dives (2–3 trends): signal, driver, trajectory, business impact, confidence band, next step.
- Strategic implications: maps each trend to a business objective and a proposed response.
- Action tracker: owner, due date, success metric, status, and follow-up date.
- Methodology appendix: scoring rubric, data sources, AI disclosure, and provenance strings.
- Decision log: what was acted on, monitored, or intentionally set aside.
Table of Contents
- Is your briefing decision-ready? A pre-distribution checklist
- How to write a BLUF executive summary that leaders actually read
- Which metrics and visuals belong in the market snapshot?
- How to structure each trend deep dive so it leads to a decision
- Translating trend insight into strategic choices
- A compact action tracker: format, owners, and follow-up rules
- Where the briefing sits in your workflow: cadence and distribution
- Methodology appendix: scoring, provenance, and AI disclosure
- A one-page briefing template you can use today
- Key takeaways
- The part most briefing guides get wrong
- Ontherice gives you the signals this template needs
- Useful sources and further reading
Is your briefing decision-ready? A pre-distribution checklist
Before you send any briefing, run through this list. If you cannot tick every item, it is not ready.
- Top three trends are named and ranked by priority.
- At least one item has changed since the previous briefing (if nothing has changed, say so explicitly).
- One recommended action is stated with a named owner and a due date.
- Each trend carries a confidence score (High / Medium / Low).
- All evidence items include a source URL and a timestamp.
- Total length is under three pages or one slide deck.
- Sources are cited and data is dated, not described as "recent."
A consistent signal filter is what separates a useful briefing from a noise dump. The most common failure is volume over utility: teams surface twelve trends when three would drive better decisions.
Pro Tip: Add a single "what we are not doing" line at the bottom of the executive summary. It tells stakeholders which signals you reviewed and consciously set aside, preventing the "why didn't you mention X?" conversation and keeping the briefing focused.
How to write a BLUF executive summary that leaders actually read
The executive summary is the briefing. Everything else is evidence. Keep it to 30–60 words and structure it in three lines.
Sample sentence templates:
- "The top trend this week is [Trend Name], currently at [stage], with [High/Medium] confidence. Momentum has [increased/held/declined] since [date]."
- "Notable movement: [one changed item] — [one sentence on why it matters]."
- "Recommended action: [specific action], owner [Name], due [date]. Priority: High."
Formatting rules that make it scannable:
- Bold the recommendation. Leaders skim; the action must be impossible to miss.
- Use High / Medium / Low triage for every trend, not numeric scores in the summary.
- Add a one-line confidence band: "Based on [n] sources, confidence is Medium — watch for confirmation by [date]."
- Never open with context or history. The first word should be the trend name or the recommendation.
A well-crafted trend narrative connects signal to implication in one breath. That is the standard the BLUF must meet.
Which metrics and visuals belong in the market snapshot?
The snapshot is a single scannable table. Each row is one trend; each column answers one question. According to best practice for weekly trend reports, the most useful columns combine qualitative observation with simple analytics.
| Trend label | Source / channel | Stage | Momentum score | Sentiment | Confidence | Recommended action | Priority |
|---|---|---|---|---|---|---|---|
| [Trend A] | Social / Search | Emerging | — | Positive | High | Test messaging | High |
| [Trend B] | Industry press | Accelerating | — | Neutral | Medium | Monitor | Medium |
| [Trend C] | Regulatory feed | Peak | 5/10 | Mixed | Low | Watch | Low |
Stage definitions: Emerging → Accelerating → Peak → Cooling. Move a trend one stage only when two independent sources confirm the shift.
For visuals, keep it proportionate to the audience. A sparkline next to the momentum score shows direction without requiring a separate chart. A stacked mini bar for channel mix (search vs. social vs. press) takes one cell and answers "where is this showing up?" A one-row table per trend, as above, is faster to read than a paragraph and easier to update each cycle.
Momentum score is calculated as: (volume change over 30 days + sentiment shift + source diversity) ÷ 3, normalised to a 1–10 scale. AI signal platforms such as Ontherice surface this directly from real-time signal feeds, removing the manual aggregation step.
How to structure each trend deep dive so it leads to a decision
Each deep dive follows the same micro-block. Keep it to six lines per trend.
- Definition (one line): What is this trend, precisely?
- Driver: What is causing it — technology shift, regulatory change, consumer behaviour, or macro force?
- Relevance: Why does it matter to your specific objectives (reach, retention, revenue, or risk)?
- Trajectory: Where is it heading over the next 30–90 days?
- Confidence band: High (multiple corroborating sources), Medium (two sources, one primary), or Low (single signal, unconfirmed).
- Next step: One specific action, not a category of actions.
Prioritisation scoring uses a simple rubric: Impact (1–5) × Momentum (1–5) × Confidence (1–3), like the method used by QuantGenie for no-code trading algorithm scoring. A trend scoring above 30 warrants a deep dive; below 15, it goes to the watch list. This keeps the briefing to two or three deep dives rather than an exhaustive catalogue.
For evidence, attach one or two representative examples, one quantitative anchor (a volume figure, a search index movement, a published statistic), and a provenance link with a timestamp. Readers should be able to re-run the signal check in under two minutes. Practical multidisciplinary deep-dive examples show how this works across sectors.

Translating trend insight into strategic choices
Trend analysis only earns its keep when it changes a decision. For each trend in the briefing, attach four decision questions:
- Does this change product prioritisation — what we build or retire next quarter?
- Does this affect pricing or positioning — how we frame value to buyers?
- Does this shift distribution or channel mix — where we show up?
- Does this introduce a risk that requires a contingency or a monitoring threshold?
Map each trend to one of four business objectives: Reach, Retention, Revenue, or Risk. Then assign a KPI to measure any response. This strategic framing approach prevents the common failure of treating trend briefings as interesting reading rather than decision inputs.
Confidence thresholds for action:
- High confidence: proceed to experiment or decision.
- Medium confidence: assign a monitor owner and a re-assessment date.
- Low confidence: log it, set a watch trigger, take no resource commitment.
A useful framing template: Trend X suggests that assumption Y may no longer hold. If confirmed by [date/source], we should test [specific change] and measure [KPI].
A compact action tracker: format, owners, and follow-up rules
Every briefing ends with this table. No exceptions.
| Action | Owner | Due date | Success metric | Confidence | Status | Follow-up date |
|---|---|---|---|---|---|---|
| [Specific action] | [Name] | [Date] | [KPI] | High/Med/Low | Open / In progress / Closed | [Date] |
Governance rules for the tracker:
- The briefing owner updates status before each distribution cycle.
- Closed actions require a two-line evidence note: what happened and what was learned.
- Any action open past its due date without a status update is escalated to the approver automatically.
Pro Tip: Keep status notes to 2–3 words ("confirmed," "delayed — vendor," "closed — positive"). Long notes in a tracker are a sign the action was not specific enough to begin with. Set a mandatory re-assessment date for every Medium or Low confidence action; without it, they quietly disappear.
Where the briefing sits in your workflow: cadence and distribution
Three cadences, three audiences, three formats.
- Daily alert channel: urgent signals only, one line per item, pushed to a shared channel (Slack, Teams, or email digest). No analysis — just the signal and a confidence flag.
- Weekly executive brief: the one-page BLUF format above, distributed 24 hours before the leadership sync. Leaders read it before the meeting; the meeting is for decisions, not for reading aloud.
- Monthly operating review: full briefing with methodology appendix, decision log, and resource implications. This is where trend calls from previous months are reviewed for accuracy.
Audience tailoring matters. Leaders get the one-page BLUF. Operations teams get the full briefing with attachments. Analysts get the raw signal appendix and provenance log. Sending everyone the same version is how briefings stop being read.
Governance checklist: named owner, named approver, distribution list, storage location (shared drive, Notion, or wiki), and access permissions documented. A structured cadence workflow is what converts a one-off briefing into an operational rhythm.
Methodology appendix: scoring, provenance, and AI disclosure
The appendix is short but non-negotiable. It is what makes the briefing defensible.
Scoring rubric:
| Dimension | 1–2 (Low) | 3–4 (Medium) | 5 (High) |
|---|---|---|---|
| Momentum | Flat or declining | Gradual increase | Rapid, multi-channel rise |
| Impact | Peripheral to objectives | Moderate relevance | Direct effect on core KPI |
| Confidence | Single source | Two sources, one primary | Multiple corroborating sources |
Provenance string format: [Source type] | [URL or ID] | [Timestamp] | [Human-validated: Y/N]
Example: Search index | trends.google.com/[query] | 2026-06-10 | Y
AI disclosure: state which AI processes were used to surface signals (e.g. Ontherice's ranking engine for scoring, plus a named LLM for summarisation), and confirm that a human analyst reviewed each output before inclusion. AI-assisted briefings can be generated in minutes using structured prompts and automated signal ingestion, but human validation of each signal is the step that keeps the briefing credible.
A one-page briefing template you can use today
Copy this structure into a document, slide, Notion page, or spreadsheet. It fits on one page at normal font size.
BLUF (3 lines) Top trend: [Name] | Stage: [Emerging/Accelerating] | Confidence: [H/M/L] Movement since last brief: [One sentence] Recommended action: [Action] | Owner: [Name] | Due: [Date]
Snapshot table (2–4 rows, columns as above)
Deep dive 1: [Trend name] Driver / Relevance / Trajectory / Confidence / Next step
Deep dive 2: [Trend name] Driver / Relevance / Trajectory / Confidence / Next step
Action tracker (one row sample as above)
Provenance footer: Sources reviewed: [n] | Data range: [dates] | AI tools used: [names] | Validated by: [Name] | Date: [Date]
Storage and export tips:
- Save as a versioned document (v1, v2) so the decision log is traceable.
- Export to PDF for distribution; keep the editable source in a shared wiki.
- For meeting use, a two-slide version works: slide one is the BLUF and snapshot, slide two is the action tracker.
Key takeaways
A decision-ready trend briefing requires a BLUF executive summary, a scored snapshot table, two or three deep dives, a strategic implications block, and a named action tracker — all in under three pages.
| Point | Details |
|---|---|
| Lead with the BLUF | Open every briefing with a 30–60 word executive summary that names the top trend, one change, and one recommended action. |
| Score before you brief | Use an Impact × Momentum × Confidence rubric; only trends scoring above 30 warrant a deep dive. |
| Name owners and dates | Every action in the tracker needs a named owner, a due date, a success metric, and a mandatory follow-up date. |
| Match format to audience | Leaders get the one-page BLUF; operations teams get the full briefing; analysts get the raw signal appendix. |
| Ontherice as your signal layer | Ontherice's AI Opportunities feed and ranking engine supply the scored, provenance-linked signals that map directly to the snapshot and methodology appendix. |
The part most briefing guides get wrong
Most guides treat trend briefings as a writing exercise. They are not. They are a decision-making tool that happens to be written down.
The structural advice in this article is sound, but the harder problem is cultural: most teams spend twenty minutes presenting signals and five minutes on decisions. That ratio should be reversed. Five minutes on signals, twenty on implications and choices. The briefing template is just the scaffold; the meeting discipline is what makes it work.
There is also a persistent confusion between comprehensiveness and usefulness. A briefing that covers twelve trends with equal weight is not thorough — it is indecisive. Prioritisation is the analytical act. Choosing to brief on three trends and explicitly setting nine aside is a stronger signal of analytical rigour than including everything and leaving the reader to sort it out.
Standardisation matters more than sophistication. The same structure, the same filters, the same scoring rubric, every cycle. That consistency is what builds a longitudinal record, and a longitudinal record is what tells you which trend calls were durable and which were noise. Transparent, traceable provenance — the kind Ontherice's platform is built around — is what makes that record auditable rather than anecdotal.
Ontherice gives you the signals this template needs
The briefing structure above works best when the signals feeding it are already scored, ranked, and traceable. That is precisely what Ontherice delivers.

Ontherice's AI engines scan global public data continuously, surfacing ranked trend signals with momentum scores, confidence ratings, and provenance links — the exact inputs the snapshot table and methodology appendix require. The rankings engine handles the Impact × Momentum scoring automatically, so your team spends time on implications rather than aggregation. The AI Opportunities feed maps directly to the deep-dive prioritisation step, giving you two or three pre-ranked candidates per cycle rather than a raw list of fifty.
Typical use cases: a weekly executive sync briefing built in under 30 minutes, a founder intelligence sheet updated every Monday, or a marketing trend sprint that runs monthly. Run a team readiness diagnostic to see where your current briefing workflow has gaps and which platform features close them fastest.
Useful sources and further reading
- How to build a weekly trend report — foundational guidance on snapshot columns, decision logs, and evidence practices.
- Founder briefing sheet for market intelligence — practical template for concise, decision-facing founder briefs.
- Monthly market report template for creators — covers audience behaviour translation and the decision log format.
- Business news highlights: trends, takeaways, and insights — demonstrates how to filter headlines into strategic implications for executive audiences.
- ChatGPT industry trends prompt: create an industry briefing in minutes — practical AI prompt workflow for rapid briefing generation with structured outputs.
- Trending report template: structure, examples and download — checklist covering research, analysis, writing, and distribution phases.
- How to write a trends report — PSFK's guide to structuring trend research for organisational and client audiences.
- How to write a trend report that makes your brand stand out — WD Editorial's guidance on tone, credibility, and original research standards.
- Ontherice blog — templates, signal examples, and deeper methodology articles for teams operationalising trend briefings.