TL;DR:
- Missing a market shift leads to strategic failure, eroding market share and benefiting competitors over years. Effective trend forecasting combines multiple analytical methods, diverse data sources, and contextual intelligence to identify early signals and adapt strategies proactively. Utilizing AI tools like OnTheRice accelerates this process, improving forecast accuracy and strategic responsiveness.
Missing a market shift is not a minor inconvenience. It is the kind of strategic failure that erodes market share, drains investment capital, and hands competitors a lead that takes years to recover. Businesses that rely on instinct alone or wait for trends to become obvious before acting are already too late. Companies using time series forecasting grow 19% faster, with top performers achieving 20% greater accuracy than peers. This guide walks you through exactly what you need, a field-tested framework, and the practical tools to turn raw market signals into decisive, early-mover advantages.
Table of Contents
- What you need for accurate trend forecasting
- Step-by-step trend forecasting framework
- Analysing, verifying, and avoiding common forecasting errors
- Strategic application and maximising business value
- The overlooked art: Why context-first trend forecasting beats blind data
- Level up your trend forecasting with OnTheRice solutions
- Frequently asked questions
Key Takeaways
| Point | Details |
|---|---|
| Structured process | Following a clear five-step framework boosts forecasting consistency and business outcomes. |
| Balance methods | Combining quantitative models with qualitative scans uncovers deeper, more resilient trend insights. |
| Avoid common errors | Testing for overfitting, bias, and black swan events strengthens prediction reliability. |
| Apply strategically | Turning accurate forecasts into tactics drives real competitive advantage. |
What you need for accurate trend forecasting
With a clear sense of the benefits, let us outline what you need before getting started.
Trend forecasting is not a single method. It is a discipline that draws from several analytical traditions, each suited to different data types and business questions. Understanding which technique to apply and when is the first real skill to develop. This understanding also underpins the broader trend forecasting process that separates reactive businesses from strategic ones.
Four core analysis methods serve as the foundation of most professional forecasting work: historical data analysis, statistical modelling and regression, time series analysis, and machine learning for hidden pattern detection. Each has a distinct purpose.
| Method | Description | Best-use scenario |
|---|---|---|
| Historical data analysis | Reviews past data to identify repeating patterns | Established markets with stable cycles |
| Statistical modelling and regression | Quantifies relationships between variables | Forecasting demand driven by specific factors |
| Time series analysis | Decomposes data into trend, seasonality, and cycle components | Sales, traffic, and volume projections |
| Machine learning | Identifies non-linear, hidden patterns across large datasets | Complex markets with many interacting variables |
Beyond technique selection, you also need the right data. This means access to structured sources such as sales records, web traffic, and industry reports, as well as unstructured sources like social media conversations, patent filings, and expert commentary. Missing either category creates blind spots.
Equally important is your scanning mindset. The most effective trend forecasters borrow signals from adjacent and unrelated industries. A shift in consumer behaviour within the gaming sector, for instance, often precedes similar shifts in retail or financial services. Cross-industry awareness expands your signal horizon significantly.
Key data and scanning requirements to have in place before you begin:
- Clean historical datasets covering at least three to five years where possible
- Real-time data feeds from social listening tools, news aggregators, and patent databases
- Domain expert networks for qualitative validation of early signals
- Analytical software capable of statistical modelling and machine learning outputs
- A structured signal log to record, date, and score emerging observations
Pro Tip: Never rely solely on quantitative data or purely qualitative intuition. The most reliable forecasts blend both. Quantitative data tells you what is happening; qualitative insight tells you why and whether it matters for your specific context.
Step-by-step trend forecasting framework
Now that you are prepared, move into the structured approach used by leading strategists.
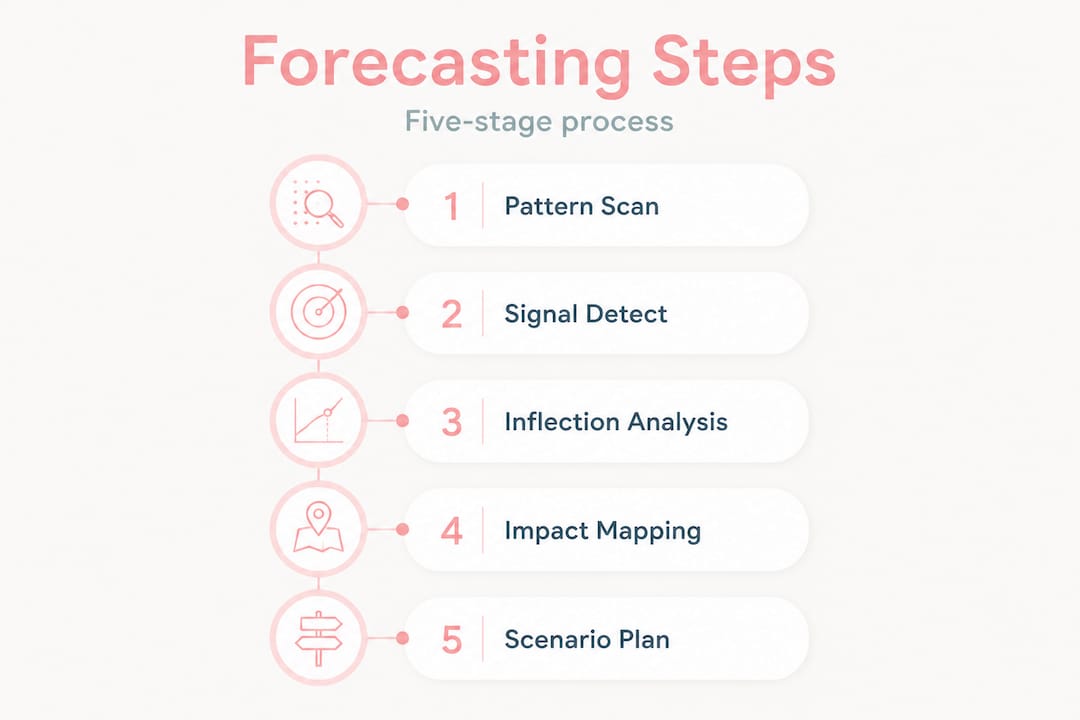
A robust forecasting framework removes guesswork and replaces it with a repeatable, evidence-based process. The five-step trend forecasting framework used by senior strategists moves from broad pattern recognition through to detailed scenario planning, ensuring that no critical signal falls through the cracks.
| Step | Focus | Key inputs | Outputs |
|---|---|---|---|
| 1. Cross-industry pattern recognition | Spot structural shifts early | Broad sector data, analogous markets | Signal shortlist |
| 2. Weak signal detection | Filter genuine signals from noise | Scanning zones, filter criteria | Prioritised signal list |
| 3. Inflection point analysis | Determine timing and scale | Historical trajectory, adoption curves | Timing window estimate |
| 4. Stakeholder impact mapping | Identify who is affected and how | Value chain data, stakeholder maps | Impact assessment |
| 5. Scenario planning | Map plausible futures | Validated signals, assumptions | Strategic scenarios |
Step 1: Cross-industry pattern recognition
Start broad. Before zooming into your specific market, scan for structural shifts happening in related and unrelated sectors. Consumer expectations shaped by on-demand streaming services eventually influenced logistics, healthcare, and banking. The businesses that saw this coming had been watching adjacent industries, not just their own data.
Step 2: Weak signal detection
Weak signals are early, fragmented indicators that something may be changing. They require scanning across five zones: technology, society, economy, environment, and politics. Once identified, apply three filters to determine whether a signal deserves further attention.
For industry signal identification, these three filters are essential:
- Convergence: Is this signal appearing across multiple unrelated sources simultaneously?
- Persistence: Has the signal appeared consistently over time rather than as a one-off observation?
- Amplification: Is the volume or frequency of references to this signal increasing?
A signal that passes all three filters warrants serious investigation. One that passes only one is worth monitoring but not acting upon yet.
Step 3: Inflection point analysis
Timing is everything in competitive strategy. Inflection point analysis asks when a trend is likely to shift from slow, early adoption to rapid mainstream uptake. This requires examining adoption curves, technology readiness levels, and regulatory signals. Acting too early wastes resources. Acting too late means competing in a crowded market.

Step 4: Stakeholder impact mapping
Every trend creates winners and losers. Map who in your value chain will be affected, how quickly, and to what degree. Suppliers, customers, regulators, and competitors each face different implications from the same trend. Understanding these dynamics shapes which strategic response will be most effective.
Step 5: Scenario planning
Rather than settling on a single forecast, develop two to four plausible scenarios reflecting different assumptions about how a trend could unfold. The purpose of scenario planning impact is not to predict the future with precision but to ensure your organisation can respond effectively regardless of which scenario materialises.
Pro Tip: When using filter criteria for weak signal detection, document your reasoning at each stage. If a signal later proves significant, this record helps you refine your scanning process. If it turns out to be noise, the documentation reveals exactly where the false positive entered your analysis.
Analysing, verifying, and avoiding common forecasting errors
You have mapped the steps, but execution quality comes down to what you avoid and how you verify your predictions.
Even experienced forecasters make systematic errors. Understanding the most common pitfalls in advance does not guarantee you will avoid them entirely, but it makes you far more likely to catch them before they distort your strategy. Common forecasting pitfalls include overfitting models to historical data, ignoring external factors or black swan events, and falling into short-term bias by over-weighting recent data.
The most damaging errors in professional forecasting practice include:
- Overfitting: Building a model that performs brilliantly on past data but fails on new inputs because it has learnt noise rather than patterns
- Short-term recency bias: Assuming that what has happened in the past 12 months will continue indefinitely, ignoring longer structural cycles
- Ignoring outliers: Treating anomalous data points as irrelevant rather than investigating whether they signal a structural change
- Black swan blindness: Failing to account for low-probability, high-impact events that fall entirely outside historical patterns
- Confirmation bias: Seeking data that supports an existing hypothesis rather than genuinely testing it
Overreliance on historical data is one of the most consistent sources of strategic error in trend forecasting. Markets evolve, technologies disrupt, and consumer behaviours shift in ways that past data cannot always anticipate. Use historical data as a foundation, not a ceiling.
To validate a forecast before committing strategic resources, triangulate across at least three independent data sources or methods. If your time series model, your qualitative expert panel, and your competitive intelligence sources all point in the same direction, confidence rises significantly. If they conflict, that tension is worth investigating before you act.
Hypothesis testing is another practical verification tool. State your forecast as a falsifiable claim, for example, "We expect category X to grow by at least 15% within 18 months." Then define the leading indicators that would signal whether you are on track or need to revise your view.
AI-driven trend discovery platforms now make it considerably easier to cross-reference signals at speed, reducing the manual burden of triangulation. However, the analytical judgement behind the process still requires human oversight.
Pro Tip: Schedule a quarterly assumption review rather than waiting for forecasts to fail. Ask yourself which of your current assumptions has the weakest evidence base, then stress-test it with a "what if" scenario. This habit prevents small errors from compounding into major strategic missteps.
Strategic application and maximising business value
With errors addressed, real gains arise from practical application and strategic follow-through.
Forecasting has no commercial value unless it translates into action. The gap between generating an insight and acting on it at the right moment is where most strategic value is either created or lost. Understanding which forecasting approach suits which type of business question is the starting point for effective application.
Strategic horizon scanning, which uses weak signals and expert methods such as Delphi panels, is best suited to macro and emerging trend analysis where historical data is sparse or unreliable. Statistical time series models, by contrast, excel at extrapolating patterns from dense historical sales or market data. The two approaches address different questions and perform best when used together.
Qualitative weak signal scanning complements quantitative time series methods by addressing precisely the limitations that purely numerical models cannot resolve, particularly the identification of black swan events or structural discontinuities that have no precedent in historical data.
For practical strategic application, validated forecasts should drive the following actions:
- Adapt product and service strategies in line with anticipated demand shifts, retiring legacy offerings before decline accelerates
- Enter or exit markets proactively, using inflection point timing to avoid both premature investment and late-mover disadvantage
- Influence key stakeholders including investors, regulators, and supply chain partners by sharing your forecasts and scenario analyses
- Redirect research and development priorities towards technologies or capabilities that will be essential in your priority scenarios
- Build organisational resilience by identifying which internal capabilities are most vulnerable to the trends you have validated
A useful real-world approach combines quantitative market data with qualitative expert insight. For example, a strategy team might use time series modelling on three years of category sales data to identify a growth inflection, then convene a panel of domain experts to assess whether the drivers behind that inflection are durable or cyclical. This combination provides both the statistical rigour and the contextual depth that neither method delivers alone.
Connecting your forecasting outputs to emerging trends across adjacent sectors sharpens your contextual reading and surfaces cross-market opportunities that single-sector analysis would miss entirely.
The overlooked art: Why context-first trend forecasting beats blind data
Beyond mechanics and best practices, consider what most trend forecasting guides miss.
Most forecasting frameworks treat data as the primary authority. Feed in enough numbers, run the right model, and the output tells you what to do. This view is reassuring. It is also incomplete. The most consequential market shifts we have observed were visible in the data but were misread because analysts lacked the contextual intelligence to interpret them correctly.
The financial crisis of 2008 is the canonical example. The data was there. Housing prices, credit default rates, and derivatives exposure were all measurable. But the context, specifically the structural incentives encouraging systemic risk-taking, was either not understood or actively ignored by those running the models. Similarly, many retailers had the traffic data showing declining footfall years before they made meaningful strategic adjustments. The data spoke clearly; the contextual reading failed.
This is not an argument against rigour. It is an argument against treating forecasting as a mechanical exercise. When you apply the framework above, you must constantly ask: what does this signal mean in our specific environment? A signal that represents a genuine threat to a mid-market consumer brand might represent an opportunity for a premium operator serving a different demographic.
Exploring disruptive trend examples across industries reinforces this point vividly. The companies that capitalised on disruption were rarely those with the most sophisticated models. They were the ones whose leadership teams had developed genuine pattern literacy, the ability to read signals through the lens of their industry's specific dynamics, competitive structure, and customer psychology.
Develop this skill deliberately. Read broadly, across industries and disciplines. Maintain a personal signal log separate from your formal forecasting process. And when your model outputs conflict with your experienced judgement, do not immediately dismiss one in favour of the other. That tension is often where the most valuable insight lives.
Level up your trend forecasting with OnTheRice solutions
For those ready to implement smarter forecasting, access tools that increase your advantage.
The framework in this guide is powerful, but executing it manually at scale is time-consuming and resource-intensive. OnTheRice is built precisely to address that gap, combining multiple AI engines that scan global data in real time to surface emerging signals before they reach mainstream awareness.
Whether you are running weak signal detection, validating inflection points, or exploring AI-driven market opportunities across sectors, OnTheRice delivers ranked, scored insights that accelerate every stage of the process described above. The platform's traffic analytics platform provides quantitative depth to complement your qualitative scanning, giving your team both breadth and precision in a single interface. If you are serious about gaining competitive advantage through early trend intelligence, OnTheRice is where that work becomes significantly faster and more reliable.
Frequently asked questions
What is the first step in effective trend forecasting?
Begin with cross-industry pattern recognition to capture early signals and establish a broad scanning base before narrowing to sector-specific analysis.
How do you distinguish between a weak signal and noise?
Apply structured filters including convergence, persistence, and amplification to determine whether an observed signal is likely to represent a genuine emerging trend rather than random variation.
Can qualitative insights help counter black swan events in forecasting?
Yes. Qualitative weak signal scanning complements quantitative methods by helping anticipate rare or disruptive events that fall entirely outside historical data patterns.
What is the main risk of relying only on historical data?
Relying solely on historical data raises the likelihood of missing black swan events, overfitting models to past patterns, and failing to account for new market drivers with no historical precedent.
How accurate is data-driven trend forecasting?
Top-performing organisations achieve roughly 20% greater forecasting accuracy than peers, with data-driven methods delivering measurable improvements over intuition-based approaches when applied with proper validation.