TL;DR:
- True competitive advantage comes from detecting subtle signals foretelling industry shifts early.
- Combining macro and industry-specific frameworks enhances the accuracy of trend analysis.
- Triangulating diverse digital, community, and financial data reveals genuine early signals.
Most businesses react to trends rather than anticipate them. They wait until a shift is obvious, until competitors have already moved, until customers have already changed their behaviour, and then scramble to adapt. The real competitive edge does not come from tracking headlines. It comes from reading the subtle, often contradictory signals that precede major industry shifts by months or even years. This article breaks down exactly how professional strategists approach trends in strategic decisions, from foundational frameworks to weak signal detection, so you can stop reacting and start anticipating.
Table of Contents
- What is industry trend analysis and why does it matter?
- Frameworks that power professional trend analysis
- Identifying types of trends and their signals
- Spotting weak signals: The art of early detection
- The uncomfortable truth about trend analysis: What professionals miss
- Ready to apply smarter industry analysis?
- Frequently asked questions
Key Takeaways
| Point | Details |
|---|---|
| Early signals matter | Spotting weak trends before the mainstream is key to outpacing competitors. |
| Frameworks are essential | Blending PESTLE and Porter's methods ensures rich, multi-level analysis. |
| Diverse data sources win | Combining digital, historical, and survey data catches both strong and subtle trends. |
| Biases hinder insight | Awareness of base-rate neglect and continuity bias prevents costly misreads of the market. |
What is industry trend analysis and why does it matter?
Industry trend analysis is the systematic process of examining shifts in a market or sector to inform strategic decisions. It is not about reading industry reports after the fact. It is about building a structured, repeatable practice for identifying where a market is heading before the destination becomes obvious.
Done well, it gives decision-makers the ability to enter new markets at the right moment, exit declining ones before losses compound, and reallocate resources toward genuine growth opportunities. Done poorly, or not at all, it leads to what analysts call base-rate neglect: the tendency to overestimate the uniqueness of current conditions and underestimate how historical patterns apply. Expert forecasts are particularly vulnerable to continuity bias, where strong recent signals receive far too much weight compared to weak but structurally significant ones.
Here is what separates surface-level trend watching from genuine industry analysis:
- Obvious signals are already priced into competitor behaviour. By the time a trend appears in trade media, the early movers have already acted.
- Latent or weak signals emerge from fringe communities, patent filings, regulatory consultations, and niche academic papers. These are the signals that precede the obvious ones.
- Inflection points are the moments when weak signals converge into structural change. Missing these is not just a strategic error; it is an expensive one.
Research on market intelligence trends consistently shows that organisations with formalised trend-scanning practices outperform peers in new product success rates and market entry timing. The cost of missing early signals compounds quickly. A business that identifies a structural shift six months before competitors can command market positioning, pricing leverage, and talent acquisition advantages that are nearly impossible to replicate after the fact.
The goal of industry trend analysis is not prediction. It is probabilistic preparedness: understanding which futures are becoming more or less likely, and building strategies that perform well across multiple scenarios. That distinction is critical for senior strategists who need to justify capital allocation without the comfort of certainty.
Frameworks that power professional trend analysis
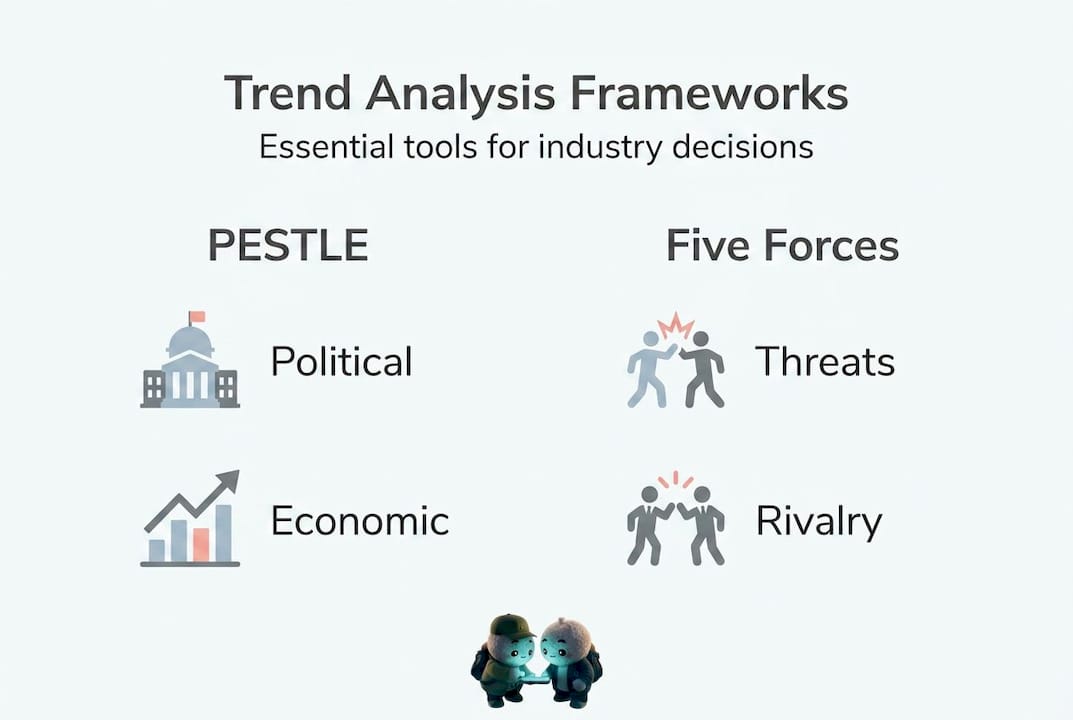
Professional trend analysts do not rely on intuition alone. They rely on structured frameworks that create repeatable, auditable insight processes. The two most foundational are PESTLE and Porter's Five Forces, and combining PESTLE and Porter's analysis delivers far more than either does in isolation.
PESTLE scans the macro-environment across six dimensions:
| Factor | What it examines |
|---|---|
| Political | Government policy, trade regulation, political stability |
| Economic | Interest rates, inflation, GDP growth, currency shifts |
| Social | Demographics, cultural shifts, consumer attitude changes |
| Technological | Innovation cycles, automation, digital infrastructure |
| Legal | Legislation changes, compliance requirements, IP law |
| Environmental | Climate policy, sustainability expectations, resource scarcity |
Porter's Five Forces then narrows the lens to your specific industry structure:
| Force | Strategic implication |
|---|---|
| Competitive rivalry | Intensity of existing competition |
| Threat of new entrants | Barriers to entry and their fragility |
| Threat of substitutes | Whether different solutions could replace your category |
| Buyer power | How much leverage customers hold over pricing and terms |
| Supplier power | Dependence on key inputs and concentration risk |
Core methodologies in professional trend forecasting combine PESTLE for macro-environmental scanning with Porter's Five Forces for industry structure assessment, producing a layered picture that neither delivers alone. This sequencing is deliberate. PESTLE reveals which macro forces are in motion. Porter's translates those forces into competitive implications for your specific sector. SWOT then consolidates findings into prioritised actions.
The recommended sequence is: environmental scanning → structural assessment → strategic synthesis. Starting with Porter's before completing PESTLE risks anchoring too quickly on current competitive dynamics while blind to the macro forces about to reshape them.
Pro Tip: Do not apply PESTLE generically. Weight the factors by sector. A pharmaceutical company should weight Legal and Political heavily. A retail brand competing in Southeast Asia should weight Social and Economic more aggressively. The framework is a scaffold, not a script.
This structured approach also makes trend analysis defensible to boards and leadership teams. When you can trace a strategic recommendation back through a documented scanning process, it shifts the conversation from "we think" to "we can demonstrate."
Identifying types of trends and their signals
Not all trends behave the same way, and confusing them leads to badly timed strategic decisions. Professional analysts distinguish between three core trend types, each requiring a different response:
| Trend type | Characteristics | Strategic response |
|---|---|---|
| Upward | Sustained growth, expanding adoption, rising investment | Enter, scale, or acquire early |
| Downward | Declining volumes, shrinking margins, exit signals | Divest, pivot, or harvest |
| Horizontal | Stable long-term performance, low volatility | Hold, optimise, watch for disruption |
Trend types including upward trends linked to economic strengthening, downward trends in declining markets, and horizontal trends in stable sectors are identified through historical data, survey methodology, Google Trends, and social media signals. Each data source adds a different layer of confidence.
The most important inputs for early signal detection span both quantitative and qualitative territory:
- Historical financial data reveals underlying patterns that strip away short-term noise
- Digital footprints including search volume trends, app download trajectories, and engagement metrics expose shifting consumer interest in real time
- Niche online communities such as specialist forums, Discord servers, and Reddit subcultures often surface emerging preferences six to eighteen months before mainstream adoption
- Social media sentiment analysis identifies whether conversation around a category is becoming more positive, urgent, or frequent
- Survey data provides structured consumer intent signals that quantitative data alone cannot capture
Tracking social signals has become a standard input for sophisticated trend teams, not because social data is inherently reliable, but because it captures the real-time pulse of behaviour change before it shows up in financial results.
The challenge is that each source is noisy in isolation. Google search spikes can reflect media coverage rather than genuine intent. Social sentiment can be distorted by coordinated campaigns. Survey data suffers from response bias. The skill lies in triangulating across sources. When digital footprints, niche community conversation, and survey intent all point in the same direction simultaneously, that convergence is far more meaningful than any single data point alone.
Understanding industry momentum requires analysts to look beyond what the numbers say individually and ask what they suggest collectively. This is where most analysts underinvest: in the synthesis step rather than the data collection step.
Spotting weak signals: The art of early detection
If identifying trend types is the foundation, detecting weak signals is where competitive advantage is actually won. Weak signals are early, often ambiguous indicators that a structural change may be underway. They are overlooked precisely because they are small, contradictory, or appear in unexpected places.

The most effective early detection draws from regulatory changes, academic papers, venture capital funding patterns, and fringe communities. Filters for separating genuine early trends from noise include convergence across multiple sources, persistence over time, and amplification through growing volume or interest. Inflection points emerge when infrastructure, economics, and social normalisation align simultaneously.
Here are five high-yield scanning zones that experienced analysts prioritise:
- Regulatory and legislative consultations: Proposed regulations often lead market behaviour by two to five years. A government consultation on data privacy in 2022 preceded major platform restructuring across entire sectors.
- Academic and patent filings: Universities and R&D labs publish signals about technological capability years before commercial deployment. A cluster of patents in a niche area is a material early signal.
- Venture capital funding flows: VC investment concentrations reveal where informed, high-stakes capital is betting on structural change before revenue materialises.
- Fringe and specialist communities: Early adopter communities practise new behaviours long before the mainstream. Monitoring them without dismissing them is a learnable discipline.
- Talent and hiring data: A sudden rise in specialised job postings from large incumbents signals internal strategic pivots before public announcements confirm them.
"The signals that matter most are rarely the loudest. They appear at the edges of your industry, in sectors adjacent to yours, and in the behaviour of people who are not yet your customers."
Once signals are collected, apply three filters before escalating them to strategic consideration. First, convergence: does this signal appear independently across multiple unrelated sources? Second, persistence: has it been present across multiple time periods, not just a single spike? Third, amplification: is the volume or frequency increasing, however slowly?
One-off spikes in search data or social discussion almost never represent genuine structural shifts. Sustained, quiet growth in fringe interest that slowly crosses into adjacent communities is a far stronger indicator than a viral moment.
Early advantage signals are often contradictory. Sentiment may be cautious or even negative while actual adoption is quietly growing. This is particularly common in cryptocurrency innovation signals, where public scepticism and rising infrastructure investment coexist for years before mainstream adoption accelerates.
Pro Tip: Build a small network of domain experts in adjacent sectors and practise structured conversations every quarter. These individuals carry observational data from their own disciplines that no scanning tool can replicate. Their fringe knowledge is often your most valuable early signal source.
The uncomfortable truth about trend analysis: What professionals miss
Here is a difficult observation from working with industry data at scale: most experienced decision-makers are not bad at identifying trends. They are bad at believing the trends they identify when those trends contradict their existing mental models.
The base-rate neglect and continuity bias in expert forecasting is well-documented. Seasoned analysts dismiss contradictory weak signals as outliers, double down on strong recent data, and miss inflection points that were, in hindsight, visible for years.
The real failure mode is not ignorance. It is selective attention. Decision-makers unconsciously filter incoming signals through the lens of current strategy. Signals that challenge the strategy are coded as noise. Signals that confirm it are coded as insight. This is not a cognitive flaw unique to underperformers. It is a structural bias that affects experienced strategists more, not less, because they have more sophisticated rationalisations available.
What the best analysts do differently is build revalidation triggers into their workflow. They set explicit conditions under which they will revisit a dismissed signal. They track emerging trends examples across sectors outside their own, specifically to import fresh pattern recognition that their home industry context would suppress.
The uncomfortable truth is this: the trends most likely to reshape your competitive position are the ones you are currently most comfortable dismissing.
Ready to apply smarter industry analysis?
Understanding the frameworks is the starting point. Acting on them requires tools built for the speed and complexity of real markets.
OnTheRice delivers AI-powered B2B market signals and social trend signals in real time, scanning global data points to surface the weak signals and early momentum that conventional research misses. Whether you are tracking a specific sector or monitoring broad market shifts, the platform's real-time industry rankings give you a structured, transparent view of what is gaining momentum before it becomes common knowledge. This is market intelligence built for professionals who cannot afford to be second.
Frequently asked questions
What is the difference between a trend and a fad in industry analysis?
A trend shows sustained directional change backed by structural evidence across multiple data sources, while a fad is short-lived and lacks underlying drivers that would support long-term impact.
How do you prioritise which signals to track for market advantage?
Focus on weak and emerging signals that meet the three filters of convergence, persistence, and amplification, as these consistently preempt major structural shifts before strong signals confirm them.
Which frameworks are essential for comprehensive industry trend analysis?
PESTLE and Porter's Five Forces are foundational; combining them provides both macro-environmental context and granular industry-level structural insight in a single analytical pass.
Can digital data replace traditional surveying for early trend detection?
Digital footprints like search and social data surface early signals faster than surveys, but triangulating them with survey intent data and historical financials produces the most reliable and actionable trend intelligence.