
TL;DR:
- Trend filtration removes noise and seasonal effects to reveal the long-term data trend. Proper filter choice and parameter settings are crucial for accurate analysis and decision-making. Using adaptive methods and understanding data context enhances the reliability of trend estimates.
Trend filtration is defined as the process of removing noise, seasonal fluctuations, and short-term irregularities from time-series data to isolate the underlying trend-cycle, which represents the long-term direction of a dataset. Standard trend-cycle estimation uses a weighted moving average of up to 13 months centred on the reference month. That centring matters because it balances past and future observations, reducing the distortion that plagues one-sided filters. For market analysts and strategists, the trend-cycle is the signal that actually drives decisions. Everything else is interference.
What is trend filtration and why does it matter?
Trend filtration is the analytical discipline of separating genuine long-term movement from the clutter that surrounds it in real-world data. Raw time-series data from sales figures, search volumes, or production indices contains at least three overlapping components: the trend-cycle, seasonal patterns, and irregular noise. Without filtration, analysts mistake a seasonal spike for structural growth, or confuse a one-week volatility event for a directional shift.

The consequences of poor filtration are concrete. Applying inappropriate filters is a primary cause of poor decision-making in quantitative analysis. A retail strategist who reads unfiltered weekly sales data in december will consistently overestimate demand. A financial analyst reading unfiltered daily price data will see reversals that do not exist. Trend filtration corrects both errors by revealing what the data actually says beneath the surface.
The recognised industry term for the output of this process is the "trend-cycle." National statistics agencies, including Statistics Canada and the UK Office for National Statistics, publish trend-cycle estimates as the authoritative version of economic indicators. Understanding how trends shape business decisions starts with understanding what the trend-cycle actually represents.
What are the main techniques used in trend filtration?
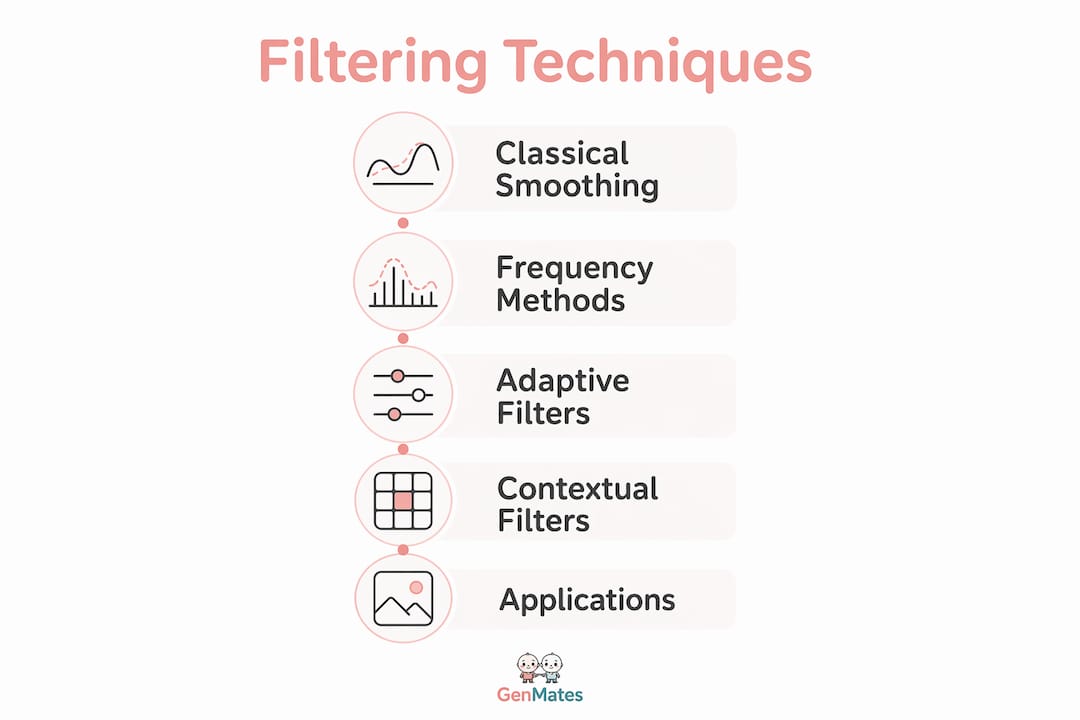
Three broad families of filtering techniques cover the majority of professional applications: classical smoothing, frequency-based filtering, and modern adaptive methods.
Classical smoothing: moving averages and Henderson filters
The simple moving average is the most widely used starting point. It calculates the mean of a fixed window of observations and advances that window one period at a time. The result is a smoother series, but the method has a critical weakness: it blurs sharp changes and creates endpoint distortion because the final observations have no future data to balance them.
Henderson filters address this directly. Henderson filters use symmetric weights that reproduce cubic polynomial trends exactly and minimise roughness. They are the gold standard for official seasonal adjustment and are built into programmes like X-13ARIMA-SEATS, which is used by major national statistics agencies worldwide. The symmetric weight structure means the filter does not systematically favour past or future observations, producing a cleaner trend estimate at interior points.
Frequency-based and adaptive methods
Low-pass filters work differently. They operate in the frequency domain, passing slow-moving (low-frequency) components and blocking fast-moving (high-frequency) noise. The Hodrick-Prescott filter, widely used in macroeconomics, is a well-known example. The trade-off is that frequency-based filters require careful parameter selection; a poorly chosen smoothing parameter produces either an over-smoothed series or one that retains too much noise.
Modern adaptive methods use piecewise polynomial regression with lasso penalties to preserve abrupt structural changes that classical filters blur. These approaches outperform traditional moving averages when the data contains genuine breakpoints, such as a sudden policy change or a market shock. The lasso penalty forces the filter to decide whether a change is a structural break or noise, rather than averaging it away.
| Technique | Mechanism | Best use case | Key limitation |
|---|---|---|---|
| Simple moving average | Arithmetic mean of fixed window | Exploratory analysis, stable series | Endpoint distortion, lag |
| Henderson filter | Symmetric weighted average | Official statistics, seasonal adjustment | Less responsive to abrupt changes |
| Low-pass filter | Frequency domain smoothing | Macroeconomic trend extraction | Sensitive to parameter choice |
| Piecewise adaptive (lasso) | Regularised polynomial regression | Series with structural breaks | Computationally intensive |
Pro Tip: Start with a Henderson filter for any series you intend to publish or present formally. Switch to an adaptive lasso method only when you have strong evidence of structural breaks in the data.
How do contextual filters improve accuracy in trend analysis?
Contextual filters are parameters applied before or alongside mathematical smoothing. They define the scope of the data being analysed: the time window, the geographic boundary, and the category or segment. Getting these wrong produces a filtered trend that is technically clean but analytically meaningless.
The time window is the most consequential contextual parameter. Recommended windows include 90 days for detecting fast momentum and five years for confirming seasonal cycles. A 90-day window captures recent acceleration in consumer interest but cannot distinguish a genuine trend from a short-lived spike. A five-year window smooths over short-term noise but may obscure a genuinely new trend that only emerged in the past quarter. Analysts working on product launches typically need both: a short window to confirm momentum and a long window to establish baseline seasonality.
Geographic filters matter equally. A search trend that appears strong at the national level may be driven entirely by one metropolitan area. Filtering by region before applying smoothing prevents that localised signal from distorting the national picture. Category filters serve the same purpose in product and market data: a broad category like "beverages" will mask divergent trends in subcategories like "functional drinks" versus "carbonated soft drinks."
- Use a 90-day window for short-term momentum signals and product launch tracking.
- Use a 12-month or 5-year window for seasonal pattern confirmation and long-term forecasting.
- Apply geographic filters at the regional level before aggregating to national estimates.
- Segment by category or product line before smoothing to avoid masking subcategory divergence.
- Consistent application of context filters is non-negotiable for comparability across reporting periods.
Pro Tip: Document your contextual filter settings alongside every filtered dataset. If the settings change between reporting cycles, your trend estimates become incomparable, even if the underlying data is identical.
Understanding why context matters in trend analysis is the difference between a trend report that informs decisions and one that simply describes noise.
What are the common misconceptions and challenges in trend filtration?
The most persistent misconception in trend filtering is that a smoother output is always a better output. Smoothness and accuracy are not the same thing.
-
Smoother does not mean more accurate. Excessive smoothing introduces lag, making trend signals unusable for real-time market actions. A 24-month moving average applied to monthly retail data will produce a beautifully smooth line that tells you what the trend was a year ago, not what it is now.
-
Endpoint distortion is a structural problem, not a data quality issue. Simple moving averages produce endpoint distortion because the final observations in a series have no future data to balance them. This is not a sign of bad data. It is a mathematical property of symmetric filters applied to finite series. Symmetric filters like Henderson reduce this problem; adaptive reinforcement learning methods reduce it further.
-
Abrupt structural changes are not outliers. When a genuine market shock occurs, a classical moving average will interpret the change as noise and smooth it away. Adaptive methods with l0-regularisation detect abrupt changes without obscuring the underlying trend. Treating a structural break as an outlier is one of the most costly errors in applied trend analysis.
-
Normalisation is not optional. Google Trends normalises data to a 0–100 scale, and failure to account for this causes misinterpretation of relative trend importance. An index score of 80 in one category and 80 in another does not mean equal search volume. It means each reached 80% of its own peak. Comparing raw index values across categories without normalisation produces misleading conclusions.
-
Filter choice is an analytical decision, not a technical default. Selecting a filtering method that does not align with the analytical goal causes either lost signals or excessive smoothing. The filter defines what counts as "the trend" in your dataset. That is an interpretive choice with real consequences for strategy.
How can market analysts apply trend filtration in practice?
Applying trend filtration effectively requires a structured approach. The filter settings you choose define the version of reality your analysis presents, so the process deserves deliberate attention.
-
Define the analytical goal first. Are you detecting early momentum, confirming a long-term direction, or identifying a structural break? Each goal calls for a different filter. Early momentum detection favours shorter windows and adaptive methods. Long-term direction confirmation favours Henderson or low-pass filters with longer smoothing lengths.
-
Set contextual parameters before applying any mathematical filter. Choose your time window, geographic scope, and category segment. Lock these settings and document them. Changing them mid-analysis invalidates comparisons.
-
Start with a 13-period Henderson filter for monthly data. This is the standard used by national statistics agencies and provides a reliable baseline. For weekly data, a 7-period or 13-period weighted moving average is a practical starting point.
-
Test for structural breaks before choosing a smoothing length. If your data contains a known event, such as a regulatory change, a product recall, or a macroeconomic shock, apply an adaptive method rather than a classical smoother. Classical smoothers will blur the break and understate its significance.
-
Validate by comparing filtered output against known events. If your filtered trend shows a peak in a period where no real-world event supports it, the filter settings are likely wrong. Adjust the smoothing length and rerun. Trend filtration is iterative; analysts must refine parameters continually as settings define the version of truth seen in the data.
-
Use software that supports multiple filter types. Platforms that only offer simple moving averages limit your analytical options. Look for tools that support Henderson filters, frequency-based smoothing, and adaptive methods. Ontherice applies multiple AI engines to noisy market data, extracting signals that single-method filtering would miss. For real-time trend insights, the ability to switch between filter types without rebuilding your dataset is a material advantage.
Key takeaways
Trend filtration produces reliable, decision-ready signals only when the filter type, smoothing length, and contextual parameters are deliberately matched to the analytical goal.
| Point | Details |
|---|---|
| Define the trend-cycle | Trend filtration isolates the long-term direction by removing noise and seasonal effects from time-series data. |
| Match filter to goal | Henderson filters suit stable series; adaptive lasso methods suit data with structural breaks. |
| Set context before smoothing | Fix time window, geography, and category before applying any mathematical filter to preserve comparability. |
| Avoid over-smoothing | Excessive smoothing creates lag that makes filtered trends useless for timely decisions. |
| Treat filtration as iterative | Refine filter parameters continually; the settings you choose define the version of reality your analysis presents. |
Why I think most analysts underestimate trend filtration
Most analysts treat trend filtration as a preprocessing step: something you do quickly before the "real" analysis begins. That framing is wrong, and it produces bad strategy.
The filter you choose is not neutral. A 3-month moving average and a Henderson filter applied to the same dataset will produce materially different trend estimates. One will show a turning point two months earlier than the other. In a fast-moving market, two months is the difference between acting on a trend and reacting to it after your competitors already have.
The error I see most often is analysts selecting a filter because it is the default in their software, not because it suits their data. Default settings are designed for average use cases. Your data is not average. A consumer goods analyst tracking weekly sell-through data has different smoothing requirements than a macroeconomist tracking quarterly GDP. Using the same filter for both is like using the same lens for a microscope and a telescope.
The rise of adaptive filtering methods and AI-driven signal extraction changes the calculus further. Platforms that apply multiple AI engines to market data, as Ontherice does, effectively run several filter types simultaneously and surface the signal that best fits the data structure. That is not a replacement for analytical judgement. It is a tool that makes the iterative refinement process faster and more systematic. The analyst still needs to understand what the filter is doing and why. But the barrier to running multiple filter configurations in parallel has dropped significantly.
Trend filtration done well is a competitive advantage. Done poorly, it is a source of confident errors.
— Aidil
Ontherice: AI-powered trend filtration for market analysts
Market analysts who need filtered, signal-ready trend data across multiple sectors will find Ontherice built for exactly that purpose.

Ontherice runs multiple AI engines against global market data, separating genuine emerging signals from noise in real time. The platform's traffic analytics tool applies filtration logic to web and market data, surfacing directional trends before they reach mainstream awareness. The Google Analytics dashboard delivers filtered, period-comparable insights without requiring manual parameter configuration. For analysts tracking emerging opportunities across sectors, the AI opportunities engine applies adaptive signal detection to identify structural shifts as they form. Ontherice is built for professionals who need filtered intelligence, not raw data.
FAQ
What is trend filtration in simple terms?
Trend filtration is the process of removing noise and seasonal effects from time-series data to reveal the underlying long-term direction. The output is called the trend-cycle.
Which filter is best for official market reporting?
Henderson filters are the gold standard for official reporting. They are used in X-13ARIMA-SEATS and adopted by major national statistics agencies for seasonal adjustment and trend-cycle estimation.
How do I choose the right time window for trend filtering?
Use a 90-day window to detect short-term momentum and a five-year window to confirm seasonal cycles. The goal determines the window, not the other way around.
What causes endpoint distortion in trend filters?
Endpoint distortion occurs because symmetric filters require future observations to balance past ones. At the end of a series, those future observations do not exist, so the filter produces less reliable estimates for the most recent periods.
How does normalisation affect trend filtration accuracy?
Normalisation ensures that filtered values from different datasets or categories are comparable. Without it, an index score of 80 in one category and 80 in another appears equivalent when the underlying volumes may differ substantially.