
TL;DR:
- Trend cycle analysis helps businesses predict market shifts by identifying genuine structural changes, not just noise. It involves continuous, statistical evaluation of data to inform strategic decisions across finance, marketing, and supply chain functions. Regular updates and validation prevent forecasting errors and enable proactive resource allocation.
Trend cycle analysis is the process of examining recurring market patterns and directional changes over time to separate genuine structural shifts from short-term noise. Business professionals who understand why analyze trend cycles gain a measurable edge: they forecast rather than react, allocate resources ahead of demand, and avoid the costly mistake of treating volatility as strategy. A bull market, for instance, is defined by asset prices rising at least 20% after a low. Without cycle analysis, that signal looks identical to a temporary bounce. The difference between the two determines whether a business expands or retreats at exactly the wrong moment.
Why analyze trend cycles to gain a competitive edge
The primary reason to analyse trend cycles is to gain a first-mover advantage by forecasting rather than reacting. Businesses that wait for a trend to become obvious in quarterly reports are already behind. Cycle analysis identifies structural shifts while they are still forming, giving analysts time to position resources, adjust product lines, or enter markets before competitors recognise the opportunity.

Understanding cycle phases also reduces what practitioners call firefighting. When a team knows a demand cycle is entering a contraction phase, they can reduce inventory and cut discretionary spend before margins compress. That is proactive resource allocation, not crisis management. The difference in outcomes between these two postures is significant across industries from retail to financial services.
The benefits of trend cycle monitoring extend across the full decision-making chain:
- Risk mitigation: Identifying cycle peaks prevents over-investment at the top of a market.
- Opportunity timing: Spotting cycle troughs signals when to acquire assets, talent, or market share cheaply.
- Forecast accuracy: Cycle-adjusted models outperform static projections during periods of structural change.
- Resource planning: Knowing where a cycle sits informs hiring, capital expenditure, and product development timelines.
- Strategic confidence: Cycle data replaces gut instinct with evidence, making board-level decisions easier to defend.
Pro Tip: Map your business's own revenue history against published economic cycle data. If your peaks and troughs align with macro cycles, your planning horizon should match the cycle length, not the fiscal year.
How do trends and cycles differ in market data?
Trends and cycles require different analytical approaches because they operate on different timeframes and are driven by different forces. Confusing the two is one of the most common errors in business forecasting.
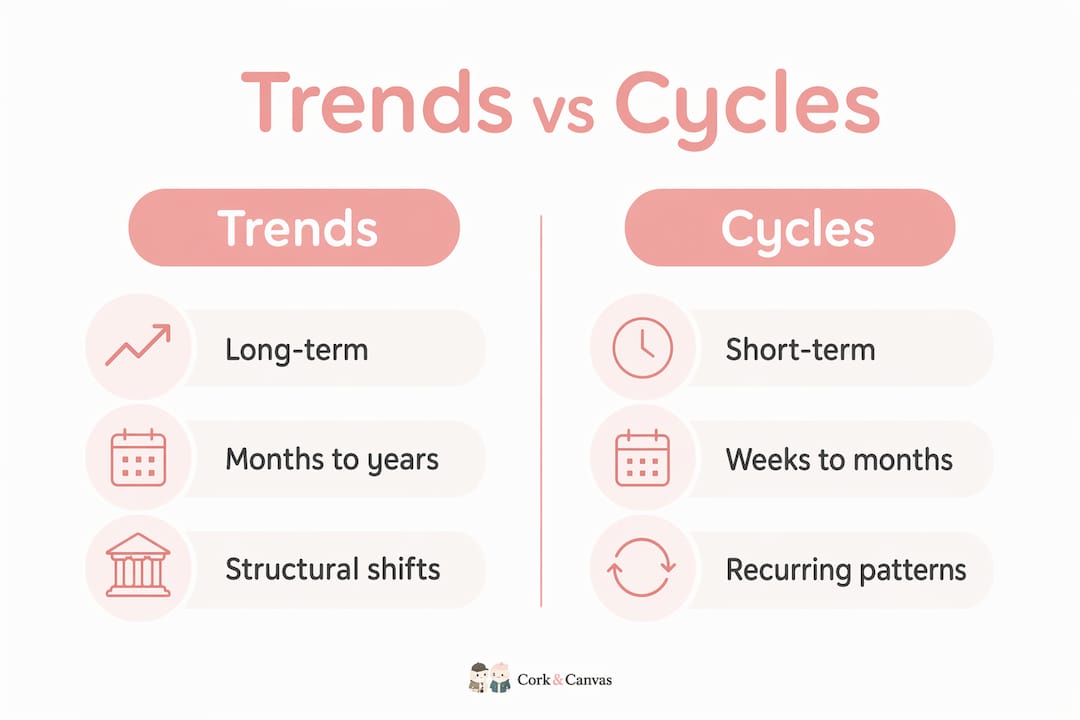
A trend is a directional movement that develops over months or years. It reflects structural shifts such as demographic change, technology adoption, or regulatory reform. A cycle is shorter in duration and more erratic. Cycles are driven by factors like interest rate policy, inventory build-up, or seasonal demand patterns. The key distinction is that trends persist; cycles repeat.
Spectral decomposition identifies structural frequencies present in data, whereas momentum indicators like RSI or MACD are lagging by design. This makes cyclic analysis more reliable for forward planning than traditional technical tools.
| Feature | Trend | Cycle |
|---|---|---|
| Timeframe | Months to years | Weeks to months |
| Primary driver | Structural shifts (tech, demographics) | Policy, sentiment, inventory |
| Analysis method | Regression, R-squared | Spectral decomposition, Bartels test |
| Predictability | High over long horizon | Moderate, frequency-dependent |
| Business use | Strategic planning | Tactical timing |
Statistically, an R-squared value above 0.65 confirms a directional pattern is real. An R-squared below 0.30 indicates the data is dominated by noise. Analysts who skip this check risk building strategy on patterns that do not exist.
How to analyse trend cycles: a structured process
Effective trend analysis follows a repeatable 9-step loop. Treating it as a one-off project is the single most common reason analysis fails to deliver value. The steps below reflect best practice for analysts working across finance, marketing, and operations.
- Define the metric. Specify exactly what you are measuring: revenue, unit volume, search demand, or price. Vague metrics produce vague insights.
- Gather and clean data. Remove duplicates, correct entry errors, and standardise date formats. Dirty data corrupts every downstream calculation.
- Test for seasonality. Use seasonal decomposition to separate recurring annual patterns from genuine directional change.
- Apply the Bartels test. This validates whether a detected cycle is statistically reliable. Scores above 70% indicate the cycle is unlikely to be random noise.
- Segment the data. Break results by geography, customer group, or product category. Aggregate data hides the cycles that matter most.
- Fit a trend model. Apply linear or polynomial regression and check the R-squared value to confirm the trend is real.
- Identify cycle phases. Determine whether the data is in expansion, peak, contraction, or trough. Each phase calls for a different business response.
- Quantify the impact. Estimate the revenue or cost effect of each cycle phase. This converts analysis into a business case.
- Automate and update. Automating data preparation avoids version conflicts and supports reliable team decision-making. Schedule updates to coincide with new data releases.
Pro Tip: Never lock a trend model after the first run. Trend-cycle data revisions are necessary as new data arrives to maintain analytical consistency and avoid series breaks. Build revision into your workflow from day one.
What are the main challenges in trend cycle analysis?
Noise is the most persistent obstacle in cycle analysis. When an R-squared value falls below 0.30, the data contains more randomness than signal. Analysts who proceed without checking this threshold build forecasts on statistical artefacts rather than real patterns.
Regime changes present a second challenge. An economic regime change, such as a shift from low to high interest rates, can break the historical relationship between a cycle and its drivers. A cycle that repeated reliably for a decade may stop doing so when the underlying policy environment changes. The Hurst exponent provides useful context here: values above 0.5 indicate a persistent trend, while values below 0.5 suggest mean-reverting behaviour.
Data revisions compound both problems. Failing to update trend-cycle data with each new release creates inconsistencies and forecasting errors. Many organisations run their models on a fixed dataset and wonder why accuracy degrades over time.
Common limitations and recommended responses:
- Low R-squared: Extend the data window or switch to a non-linear model before drawing conclusions.
- Regime transitions: Introduce structural break tests and segment pre- and post-break data separately.
- Data revisions: Automate ingestion of revised releases and flag any model outputs that predate the revision.
- Overfitting: Validate models on out-of-sample data before using them for live decisions.
- Confirmation bias: Rotate analytical responsibility across team members to challenge entrenched assumptions.
Integrating trend cycle insights with broader qualitative intelligence, such as customer interviews or regulatory monitoring, reduces the risk of any single statistical failure derailing a strategic decision.
Where does trend cycle analysis apply across business functions?
Trend cycle analysis applies across every function that depends on forward-looking data. The trend lifecycle shapes decisions in finance, marketing, supply chain, and product development in distinct but complementary ways.
In financial markets, cycle analysis informs entry and exit timing. A portfolio manager who identifies that equities are entering a late-cycle contraction phase can rotate into defensive assets before the broader market reprices. In marketing, product lifecycle forecasting uses trend data to determine when to increase spend behind a growing category and when to harvest a maturing one.
Supply chain teams use cycle data to manage inventory. A business that knows consumer electronics demand follows a roughly 18-month cycle can time procurement to avoid both stockouts at the peak and write-downs at the trough. Strategic planning teams use multi-year trend data to set capital expenditure budgets that reflect where demand will be in three years, not where it is today.
| Business function | Typical cycle duration | Primary benefit |
|---|---|---|
| Financial markets | Weeks to quarters | Entry and exit timing |
| Marketing and brand | 6–18 months | Spend allocation and launch timing |
| Supply chain | 3–18 months | Inventory and procurement planning |
| Product development | 1–5 years | Roadmap prioritisation |
| Strategic planning | 3–10 years | Capital allocation and market entry |
Analysts who structure trend opportunities around these cycle durations make decisions that are calibrated to real market rhythms rather than arbitrary planning periods.
Key takeaways
Trend cycle analysis is the most reliable method for separating genuine market shifts from noise, and it requires a continuous, automated process to deliver consistent strategic value.
| Point | Details |
|---|---|
| Trends differ from cycles | Trends span months to years; cycles are shorter and driven by policy or sentiment. |
| Statistical validation matters | An R-squared above 0.65 confirms a real trend; the Bartels test validates cycle reliability. |
| Analysis must be continuous | Updating models with each new data release prevents forecasting errors and series breaks. |
| First-mover advantage is real | Cycle-aware businesses forecast demand shifts before competitors recognise them. |
| Apply across all functions | Finance, marketing, supply chain, and strategy each benefit from cycle-adjusted planning. |
Trend analysis is a discipline, not a deliverable
The most persistent misconception I encounter is that trend cycle analysis is a project with a start and end date. Teams commission a report, receive a set of charts, and file them away until the next planning cycle. By that point, the data has been revised, the regime may have shifted, and the conclusions are stale.
What actually works is treating cycle analysis as an ongoing discipline embedded in weekly or monthly workflows. The teams I have seen get the most value from it are those who automate data ingestion, assign ownership of cycle monitoring to a named analyst, and build revision checkpoints into their planning calendar. They do not wait for a crisis to ask what the trend is doing.
The other nuance worth stating plainly: cycle analysis is not a replacement for judgement. A Bartels score above 80% tells you a cycle is statistically reliable. It does not tell you whether a regulatory change will break it next quarter. The best analysts use cycle data as one input among several, not as a standalone oracle. Integrating statistical signals with qualitative intelligence is what separates genuinely useful analysis from impressive-looking charts that nobody acts on.
— Aidil
Ontherice: AI-driven trend cycle intelligence
Identifying real signals in noisy market data is exactly what Ontherice is built for. The platform runs multiple AI engines across global data points to generate real-time market signals and ranked trend scores, giving analysts a structured view of what is gaining momentum before it reaches mainstream awareness.

For professionals who want to go deeper, the Ontherice trend analysis whitepaper sets out the methodologies behind its signal generation and ranking system. Analysts working across international markets can also access global market signals covering multiple asset classes and sectors. The platform is designed for professionals who need cycle intelligence that updates continuously, not quarterly.
FAQ
What is trend cycle analysis?
Trend cycle analysis is the process of separating long-term directional movements from shorter-term recurring patterns in market data. It uses statistical methods such as spectral decomposition and regression to identify genuine signals rather than noise.
How do you validate a detected market cycle?
The Bartels test validates cycle reliability. Scores above 70% indicate the cycle is unlikely to be random, and scores above 80% indicate strong reliability for business strategy.
Why does trend analysis need to be continuous?
Trend-cycle data requires revision each time new data is released. Failing to update models creates inconsistencies and forecasting errors that compound over time.
What R-squared value confirms a real trend?
An R-squared value above 0.65 confirms a directional pattern is statistically real. Values below 0.30 indicate the data is dominated by noise rather than a genuine trend.
How does trend cycle analysis differ from using momentum indicators?
Cyclic analysis uses spectral decomposition to identify structural frequencies in data. Momentum indicators like RSI and MACD are lagging by design, making them less reliable for forward-looking strategic decisions.