TL;DR:
- Trend attribution involves identifying the root causes behind changes in business metrics rather than just recognizing that a change occurred. It relies on causal inference methods like ITS, DiD, and KDA to separate genuine effects from noise, seasonal patterns, and external shocks. Proper data quality, continuous recalibration, and using multiple methods enhance the reliability of insights across industries such as marketing, finance, and climate risk.
Trend attribution is defined as the analytical process of assigning quantifiable root causes to observed changes in business or market metrics, explaining why a trend occurs rather than simply detecting that it has occurred. Where anomaly detection flags a spike in sales or a drop in engagement, trend attribution tells you whether that shift came from a seasonal cycle, a competitor's campaign, a regulatory change, or genuine demand growth. Methods like Interrupted Time Series (ITS), Difference-in-Differences (DiD), and Key Driver Analysis (KDA) from GoodData form the backbone of this discipline. The impact of trend attribution on resource allocation and ROI measurement is now measurable and significant across finance, marketing, and climate risk sectors.
What is the role of trend attribution in business analytics?
Trend attribution sits at the intersection of causal inference and business intelligence. Its core function is to separate genuine strategic effects from background noise, seasonal patterns, and external shocks. Without it, analysts risk misreading a market recovery as the result of their own campaign, or confusing a regulatory tailwind with operational improvement.

The importance of trend attribution becomes clearest when budget decisions are on the line. Organisations that integrate causal attribution into their analytics workflows can quantify the ROI of specific initiatives distinctly from broader market effects. That precision changes how capital gets allocated and which programmes get renewed.
The discipline has also moved well beyond marketing. In climate and insurance sectors, EU agencies are now planning sub-72-hour attribution statements to support insurance disputes and legal proceedings. That speed requirement has pushed the field towards automation and explainable AI systems that can deliver credible causal narratives under time pressure.
Which methods are used in trend attribution analysis?
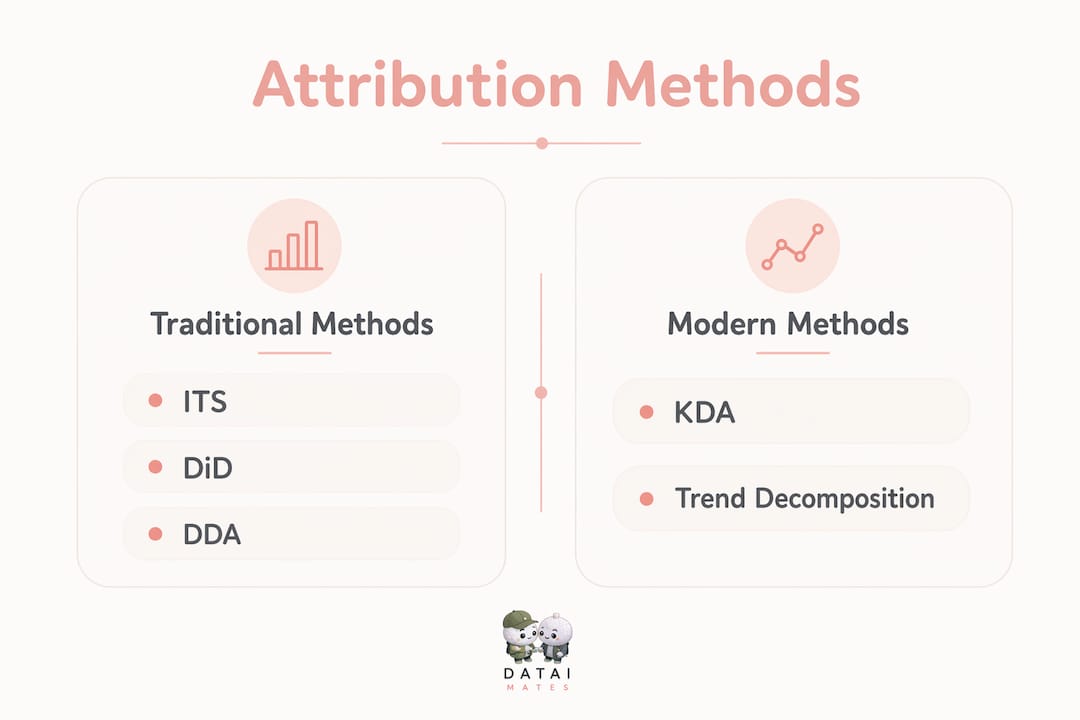
Four principal methods dominate trend attribution analysis in 2026. Each operates on different assumptions and suits different data environments.
- Interrupted Time Series (ITS): ITS compares time-series data before and after a defined intervention, controlling for seasonality and autocorrelation. It is particularly effective for measuring marketing ROI in e-commerce settings where confounders are numerous. The method prevents misleading causal claims by building a statistical counterfactual of what would have happened without the intervention.
- Difference-in-Differences (DiD): DiD isolates causal effects by comparing a treated group against a control group over the same time period. It assumes parallel trends between the two groups before the intervention. DiD improves ROI accuracy by controlling for external trends, making it a standard tool for measuring campaign impact in competitive markets.
- Key Driver Analysis (KDA): GoodData's KDA automates the ranking of factors affecting KPIs, producing explainable dashboards that show the direction, size, and share of each driver's impact. KDA outputs are delivered directly in dashboards, reducing the time between data collection and strategic decision.
- Data-Driven Attribution (DDA): DDA uses machine learning to assign fractional credit across multiple touchpoints. It is becoming the standard in multi-channel marketing analytics, though it requires regular recalibration as privacy regulations evolve and data inputs shift.
A fifth technique worth noting is Trend Decomposition, which breaks a broad trend into specific components such as individual brands, products, or creators driving growth. Platforms like TikTok generate data that Trend Decomposition can parse to reveal recurring winners and momentum accelerators that headline metrics obscure entirely.
Pro Tip: Never rely on a single attribution method. Use at least two approaches on the same dataset and compare outputs. Convergence between methods builds confidence; divergence signals a data quality or assumption problem worth investigating before acting.
ITS vs DiD vs KDA vs DDA: which method fits your needs?
Choosing the right attribution method depends on your data maturity, time constraints, and the nature of the business question. The table below compares the four principal methods across the criteria that matter most to analysts.
| Method | Speed | Complexity | Data Requirements | Interpretability | Best Use Case |
|---|---|---|---|---|---|
| ITS | Moderate | Medium | Time-series with clear intervention point | High | Marketing ROI, policy impact |
| DiD | Moderate | Medium | Treated and control groups, parallel trends | High | Campaign measurement, quasi-experiments |
| KDA | Fast | Low | KPI data with multiple potential drivers | Very High | Dashboard diagnostics, executive reporting |
| DDA | Fast | High | Multi-touchpoint journey data | Low to Medium | Multi-channel marketing attribution |
The trade-off between causal depth and operational speed is real. ITS and DiD deliver rigorous causal inference but require careful setup and clean historical data. KDA and DDA are faster and more automated, but KDA's explainability advantage over DDA is significant. Explainable AI attribution consistently outperforms black-box predictions when the goal is to drive strategic decisions rather than simply generate a score.
For portfolio management, ITS is the natural choice when isolating manager skill from market-driven returns across defined periods. For a marketing team measuring a single campaign's lift, DiD is often faster and sufficient. For a chief executive who needs a weekly KPI diagnostic without a data science team, KDA is the most practical entry point.
Pro Tip: If your organisation is new to causal attribution, start with KDA. It requires the least setup, produces immediately readable outputs, and builds internal confidence in the approach before you invest in more complex modelling.
What challenges affect the accuracy of trend attribution?
Trend attribution is only as reliable as the inputs and assumptions behind it. Several categories of failure are common, and understanding them is as important as knowing the methods themselves.
- Correlation mistaken for causation: The most frequent error in attribution work is treating a correlated variable as a cause. Causal inference methods like ITS and DiD exist specifically to address this, but analysts who skip these frameworks and rely on regression alone routinely misattribute seasonal effects or external shocks as strategic outcomes.
- Data fragmentation and missing touchpoints: Data quality issues affect attribution accuracy more than algorithm choice in most real-world deployments. Fragmented datasets, missing customer journey touchpoints, and inconsistent data collection across channels all degrade model outputs before any analysis begins.
- Confounding events and seasonality misinterpretation: A product launch that coincides with a seasonal peak, or a campaign that runs during a competitor's crisis, creates confounders that distort attribution results. Models must be explicitly designed to account for these overlapping effects, not assumed to handle them automatically.
- Black-box model risk: DDA and other machine learning approaches can produce accurate aggregate outputs while remaining entirely opaque about the reasoning behind them. Without explainability, leadership cannot validate conclusions, and analysts cannot identify when a model has gone wrong.
- Treating attribution as a one-off exercise: Attribution is ongoing infrastructure, not a project with a completion date. Market conditions shift, privacy regulations change, and consumer behaviour evolves. Models that are not recalibrated regularly produce increasingly unreliable outputs over time.
The practical implication is that data engineering investment often delivers more value than model sophistication. A well-structured, complete dataset running through a straightforward ITS model will outperform a complex neural network fed fragmented, inconsistent inputs.
How does trend attribution shape decisions across industries?
The practical applications of trend attribution span industries in ways that are often underappreciated. Here are five concrete examples of where the method changes outcomes.
- Marketing budget allocation: A retail brand running concurrent paid search, social, and email campaigns cannot determine which channel drove a sales uplift without attribution analysis. DiD or DDA separates channel effects from seasonal demand, allowing budget to follow genuine performance rather than coincidence.
- Portfolio management: Asset managers use ITS to isolate fund manager skill from market-driven returns over defined periods. Without this separation, a bull market masks poor stock selection, and a bear market penalises skilled managers unfairly.
- Climate and insurance risk: The shift in attribution science from asking whether climate change caused an event to quantifying how it modified the probability of that event has given insurers and regulators a quantitative basis for legal and financial decisions. Sub-72-hour attribution statements are now a planning requirement for EU agencies.
- Product development prioritisation: Trend Decomposition applied to platform data reveals which specific products or creators are driving category growth. Teams that act on this granular signal can structure trend opportunities before competitors identify the same pattern.
- Automated anomaly triage: Hybrid attribution systems combine rapid statistical flags with deeper causal modelling. Automated alerts trigger expert investigation only when anomalies exceed statistical thresholds, preventing analyst time from being consumed by noise while ensuring genuine signals receive attention. This approach, drawing on Granger causal inference principles, is now used in climate science and increasingly in financial risk monitoring.
The common thread across all five applications is the same: attribution converts ambiguous data into defensible conclusions. That is what makes it a strategic asset rather than a technical exercise.
Key takeaways
Effective trend attribution requires rigorous causal methods, clean data pipelines, and continuous recalibration to deliver reliable strategic insights.
| Point | Details |
|---|---|
| Define the question first | Choose your attribution method based on the business question, not data availability alone. |
| Causal methods over correlation | ITS and DiD prevent misattribution of seasonal effects or external shocks as strategic outcomes. |
| Data quality is the primary constraint | Fragmented or incomplete datasets degrade attribution accuracy more than algorithm choice. |
| Explainability drives adoption | Transparent causal narratives from tools like GoodData's KDA build leadership trust and lead to action. |
| Attribution is continuous | Models must be recalibrated regularly as market conditions, privacy rules, and consumer behaviour evolve. |
Why most attribution work falls short before the analysis even starts
I have reviewed attribution projects across marketing, finance, and operations, and the failure point is almost never the method. It is the data. Teams spend weeks selecting between ITS and DiD, debating model parameters, and building dashboards, while the underlying dataset has three months of missing touchpoints and inconsistent channel tagging. The model then produces a precise-looking output that is built on a flawed foundation.
The second most common mistake is treating attribution as a deliverable rather than a practice. A team runs a rigorous DiD analysis for a Q3 campaign, presents the results, and then returns to gut-feel budget decisions for Q4. The value of attribution compounds when it is embedded in regular workflows, not extracted as a one-off report.
My honest recommendation is to invest in AI-driven trend discovery tools that combine automated signal detection with explainable outputs. The combination of speed and transparency is what gets attribution findings acted upon. A black-box model that produces a number nobody can explain will be ignored by every senior decision-maker I have ever worked with. An explainable system that shows direction, magnitude, and confidence, even if slightly less precise, will change how budgets are set.
Triangulation is the professional standard. Use two methods on the same question. If ITS and DiD converge, you have a defensible conclusion. If they diverge, you have a data problem worth solving before you act.
— Aidil
How Ontherice supports trend attribution for analysts
Ontherice is built for exactly the challenge this article describes: separating genuine market signals from noise before competitors do. Its AI engines scan global data points, extract meaningful drivers, and produce ranked signals with the transparency that attribution work demands.

For analysts who need to move from signal detection to causal understanding, the GeneralSignals platform provides real-time market intelligence across sectors, while SignalsInternational extends that coverage globally. Both tools are designed to surface the kind of early, attributable trend data that feeds directly into ITS, DiD, and KDA workflows. If you are building an attribution practice rather than running a one-off analysis, Ontherice gives you the data infrastructure to make that practice reliable.
FAQ
What is trend attribution in business analytics?
Trend attribution is the process of assigning quantifiable root causes to observed changes in business or market metrics. It answers why a metric changed, not just that it changed, using methods like ITS, DiD, and KDA.
How does trend attribution differ from anomaly detection?
Anomaly detection identifies that a metric has deviated from expected behaviour. Trend attribution explains why it deviated by isolating causal factors such as campaigns, seasonality, or external events.
Which trend attribution method is best for marketing?
Difference-in-Differences is widely used for campaign measurement because it controls for external trends by comparing treated and control groups. Data-Driven Attribution is the standard for multi-channel environments where touchpoint data is available.
How often should attribution models be recalibrated?
Attribution models should be recalibrated continuously as market conditions, privacy regulations, and consumer behaviour evolve. Treating attribution as a one-off exercise produces increasingly unreliable outputs over time.
What is the biggest risk in trend attribution analysis?
The biggest risk is confusing correlation with causation. Without causal inference methods like ITS or DiD, analysts routinely misattribute seasonal effects or external shocks as the result of their own strategic actions.