
TL;DR:
- Trend saturation occurs when demand for a product or trend plateaus because most potential customers have already adopted it. Recognizing early signs through metrics like supply-demand ratios and marketplace signals allows businesses to plan ahead and avoid resource waste, especially when multiple indicators confirm saturation over several weeks.
Trend saturation is defined as the stage where demand for a product or trend plateaus because most potential adopters have already engaged, leaving replacement demand as the primary driver of ongoing sales. The formal industry term is market saturation, and it marks the maturity phase of the product lifecycle. At this point, new customer growth slows sharply, profit margins compress, and competitive intensity rises. For business professionals and trend analysts, recognising saturation early is the difference between repositioning ahead of the curve and being caught defending a declining market share.
Saturation does not mean zero demand. Existing customers continue replacing or upgrading, which sustains revenue but masks the underlying growth problem. The danger is that slowing new-customer acquisition compresses profits faster than most teams anticipate. Understanding trend saturation at this level of precision is what separates reactive businesses from those that plan ahead.

What key indicators help you assess trend saturation?
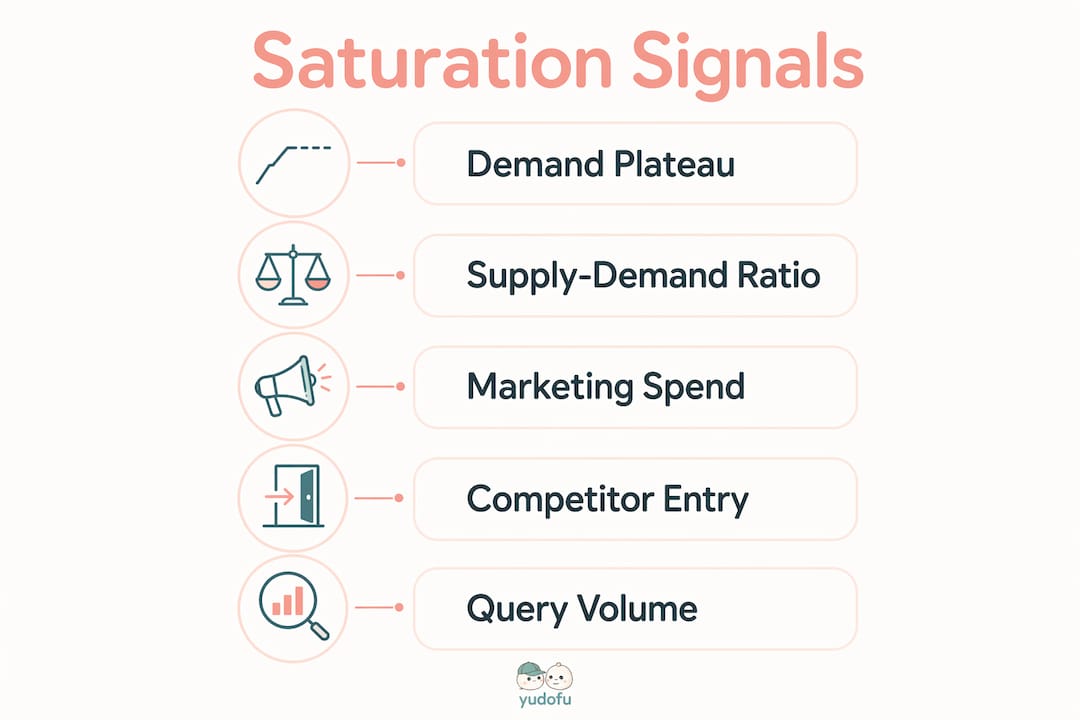
Trend saturation analysis begins with supply-demand ratios. A ratio below 0.7 signals undersupply, 0.7–0.9 indicates balance, and above 0.9 signals approaching saturation. A ratio above 1.0 confirms oversupply. These thresholds give analysts a quantitative anchor rather than relying on qualitative gut feel.
Marketplace signals add a second layer of confirmation. Hard saturation indicators include:
- CPC increases above 15% quarter-over-quarter
- Unique advertiser growth exceeding 20% in a category
- Organic rank decay of three or more positions per month
- Price compression of 8–10% or more across listings
These marketplace saturation signals are leading indicators. They appear before revenue decline becomes visible in financial reports, which is precisely why monitoring them weekly matters.
Saturation curves in marketing spend reveal a parallel pattern. Additional budget yields steep returns early, then tapers, then flattens at the saturation point. Beyond that point, spend is wasted. Marginal ROAS analysis, which measures the return on the next unit of investment rather than the average, is the most reliable method for detecting this inflection.
| Metric | Threshold | Implication |
|---|---|---|
| Supply-demand ratio | Above 0.9 | Approaching saturation |
| CPC change (QoQ) | Above 15% | Competitive crowding |
| Organic rank decay | 3+ positions per month | Visibility erosion |
| Price compression | 8–10%+ | Margin pressure |
| Unique advertiser growth | Above 20% | Supply-side saturation |
Pro Tip: Require two simultaneous red flags before acting. Single-metric changes are often seasonal noise. Structural saturation shows up persistently across multiple metrics over several weeks.
How does saturation vary across industries and markets?
Brand-level saturation consistently precedes category saturation. A retailer opening a fifth location in the same city will cannibalise its own existing stores before the broader category reaches its ceiling. Brand cannibalisation occurs earlier than category saturation, which means expansion decisions require a cannibalisation overlay to avoid destroying incremental revenue.
Geographic and demographic factors shift saturation timelines significantly. A technology product that is saturated in Western European markets may still be in its growth phase across Southeast Asian markets. Analysts who treat saturation as a global condition rather than a market-specific one routinely misallocate resources.
The contrast between emerging and mature markets is particularly instructive. Mature markets show compressed margins, high advertiser density, and standardised product features. Emerging markets show rapid adoption curves, pricing power, and limited competitive supply. The trend lifecycle stages of bloom, growth, saturation, and decline play out at different speeds depending on infrastructure, income levels, and cultural adoption patterns.
| Context | Saturation Signal | Strategic Response |
|---|---|---|
| Retail expansion (same city) | Own-store cannibalisation | Pause expansion, audit trade areas |
| Technology (mature market) | Feature standardisation, CPC spike | Differentiate or pivot to adjacent category |
| Technology (emerging market) | Rapid adoption, low CPC | Invest ahead of saturation curve |
| Consumer goods (global brand) | Price compression, rank decay | Shift budget to replacement demand campaigns |
The table above shows that saturation is not a single event. It is a condition that manifests differently depending on the unit of analysis, whether that is a brand, a category, a geography, or a demographic segment.
What are the strategic implications for marketing and product innovation?
Allocation saturation and market saturation are not the same thing. Confusing these two types leads directly to poor budget decisions. Allocation saturation means a specific channel has hit diminishing returns, but the addressable market still has room. Market saturation means the total addressable demand has peaked. Cutting spend because a single channel is saturated, when the market is not, is a costly mistake.
The strategic response to saturation follows a clear sequence:
- Audit channel efficiency using marginal ROAS, not average ROAS, to identify which channels are genuinely saturated versus underperforming.
- Shift messaging from acquisition to retention and replacement, since existing customers drive the majority of revenue in mature markets.
- Identify adjacent categories where the brand's existing equity can open new demand pools before the core category fully declines.
- Accelerate product differentiation to delay commoditisation. Apple's annual iPhone refresh cycle is a textbook example of sustaining demand through incremental innovation rather than waiting for the category to decline.
- Monitor competitor behaviour for signs of retreat. When weaker competitors exit, margin recovery becomes possible even within a saturated category.
Marketing mix modelling reveals the precise saturation point across channels, which improves budget allocation and prevents overinvestment. Businesses that run this analysis quarterly are better positioned to reallocate spend before margins erode.
Pro Tip: Saturation is a strategic opportunity as much as a threat. Brands that identify saturation early can exit expensive acquisition channels, reduce waste, and reinvest in innovation while competitors are still fighting over a shrinking pool of new customers.
How can analysts forecast trend saturation before it arrives?
Forecasting trend saturation requires multi-source validation. A single data point, whether a search volume plateau or a CPC spike, is insufficient. Rising mentions from 2% to 18% treated as priorities must be corroborated by matching search trends and review volume before analysts can confirm saturation is approaching rather than a temporary fluctuation.
AI-driven signals provide the earliest warnings available. Plateauing query volume, competitor entry saturation, and standardisation of AI-generated responses on a topic are all leading maturation signs. AI trend visibility can predict saturation four to twelve weeks ahead of when it becomes visible in traditional marketing dashboards. That window is the repositioning runway.
Practical forecasting uses the following leading indicators:
- Plateauing search query volume across Google Trends and category-specific tools
- Competitor entry rate slowing after a period of rapid growth
- VC funding cycles shifting away from a category, signalling institutional belief that growth has peaked
- AI response standardisation, where AI tools begin giving near-identical answers about a topic, indicating the knowledge base has matured
- Cross-source corroboration, where multiple data sources confirm the same saturation signal simultaneously
The trend forecasting process integrates these signals into a lifecycle framework. Analysts map each trend against bloom, growth, saturation, and decline phases, then assign probability weights to each stage based on the number of confirming signals present.
Pro Tip: Use real-time AI dashboards to track query volume and competitor density weekly. Manual monitoring of these signals monthly is too slow. By the time saturation is obvious in monthly reports, the repositioning window has already closed.
Key takeaways
Trend saturation is manageable when analysts detect it early, validate signals across multiple sources, and act before margins compress.
| Point | Details |
|---|---|
| Core definition | Saturation marks the maturity stage where new demand slows and replacement demand dominates. |
| Measurable thresholds | Supply-demand ratios above 0.9, CPC rises above 15%, and rank decay of 3+ positions confirm saturation. |
| Brand vs category | Brand-level saturation arrives before category saturation, requiring cannibalisation analysis in expansion decisions. |
| Two saturation types | Allocation saturation and market saturation require different responses; confusing them wastes budget. |
| Forecast window | AI signals provide a four to twelve week advance warning, giving analysts time to reposition before decline. |
Saturation signals are rarely what they first appear to be
The most common mistake I see among experienced analysts is treating saturation as a binary event. A market is either saturated or it is not. That framing causes teams to either panic at the first sign of slowing growth or dismiss clear warning signals as noise.
The reality is that saturation is a gradient. A category can be saturated in London and still growing in Manchester. A channel can be saturated at current spend levels but still productive at a lower budget. The skill is not in detecting saturation but in calibrating how saturated and where it is occurring.
Cross-source validation is the discipline that separates confident decisions from expensive guesses. When search volume, review sentiment, competitor density, and pricing data all point in the same direction, the signal is real. When only one source is flashing red, the right call is to wait for corroboration rather than act.
Saturation also creates genuine opportunity for analysts who stay patient. When a category reaches peak saturation, weaker competitors exit, advertising costs fall, and the brands with the strongest retention economics win. The analysts who forecast this phase correctly can advise their organisations to hold position while others retreat, then capture share at lower cost.
— Aidil
Ontherice: AI tools for saturation forecasting
Spotting saturation before it hits your margins requires more than a spreadsheet. Ontherice uses multiple AI engines to scan global data points, extract meaningful signals, and rank trends by momentum in real time.

Business professionals and trend analysts use Ontherice's AI opportunities platform to identify which categories are approaching saturation and which are still in early growth. The AI tools collection provides dedicated resources for tracking query volume, competitor density, and pricing signals across markets. For analysts who need to act on saturation forecasts weeks ahead of competitors, Ontherice delivers the early warning infrastructure that manual monitoring cannot match.
FAQ
What is trend saturation in simple terms?
Trend saturation is the point where most potential customers have already adopted a product or trend, leaving only replacement purchases to sustain demand. New customer growth slows sharply, and profit margins begin to compress.
How do I identify trend saturation in my market?
Track supply-demand ratios, CPC trends, organic rank changes, and price compression weekly. Structural saturation requires at least two simultaneous red flags persisting across multiple weeks, not a single data point.
How does trend saturation differ from allocation saturation?
Market saturation means total addressable demand has peaked. Allocation saturation means a specific marketing channel has hit diminishing returns. Confusing the two leads to cutting spend in markets that still have growth potential.
How far in advance can analysts forecast trend saturation?
AI-driven signals, including plateauing query volume and competitor entry rates, can provide four to twelve weeks of advance warning before saturation becomes visible in standard marketing dashboards.
What is the best framework for trend saturation analysis?
Map each trend against the lifecycle stages of bloom, growth, saturation, and decline. Assign confirming signals from multiple sources, including search trends, competitor data, and pricing signals, before concluding a trend has reached saturation.