

TL;DR:
- Trend velocity measures how quickly and in which direction a market trend is changing, serving as a proactive indicator for analysts. It provides early signals by assessing trend acceleration and deceleration, unlike volume or speed alone, which are lagging or insufficient metrics. Accurate measurement involves linear regression validation with an R-squared above 0.70 and supporting momentum indicators for reliable insights.
Trend velocity is defined as the rate and direction at which a market or data trend changes over time, and it is the single most predictive signal available to analysts working in fast-moving markets. Unlike raw volume or simple speed, velocity tells you where a trend is heading and how fast it is accelerating or decelerating. Tools such as linear regression with R-squared validation, the Rate of Change (ROC) indicator, and the Accelerator Oscillator are the standard instruments for quantifying this. The 'zero-hour' advantage — capturing a trend at its earliest inflection point — is only possible when velocity is at the centre of your analysis framework.
Why trend velocity matters: the core case
Trend velocity is the formal term used across financial analysis, market intelligence, and data science to describe the combined measure of a trend's speed and direction. Speed alone tells you how much something has moved. Velocity tells you whether that movement is accelerating, decelerating, or reversing. That distinction is the difference between reacting to a market and anticipating it.

High-velocity but low-volume trends are more predictive of market shifts than high-volume but low-velocity trends. High volume with low velocity typically signals a mature or stagnant market. This means the analyst who monitors velocity is reading the market's energy, not just its size.
The importance of trend velocity becomes clearest when you consider what volume metrics miss. Volume tells you what has happened; velocity reveals the energy behind the move, making it a leading indicator rather than a lagging one. For product launches, market entry decisions, and content strategy, acting on lagging data is a structural disadvantage. Velocity closes that gap.
Velocity-based SEO strategies have become central to competitive positioning in 2026, with AI-driven engines rewarding content that aligns with rising demand before it peaks. This is not a niche trading concept. It applies directly to how businesses capture search traffic, identify product opportunities, and time market moves. Understanding trend lifecycle dynamics alongside velocity gives analysts a complete picture of where a trend sits in its arc.
How is trend velocity measured and validated?
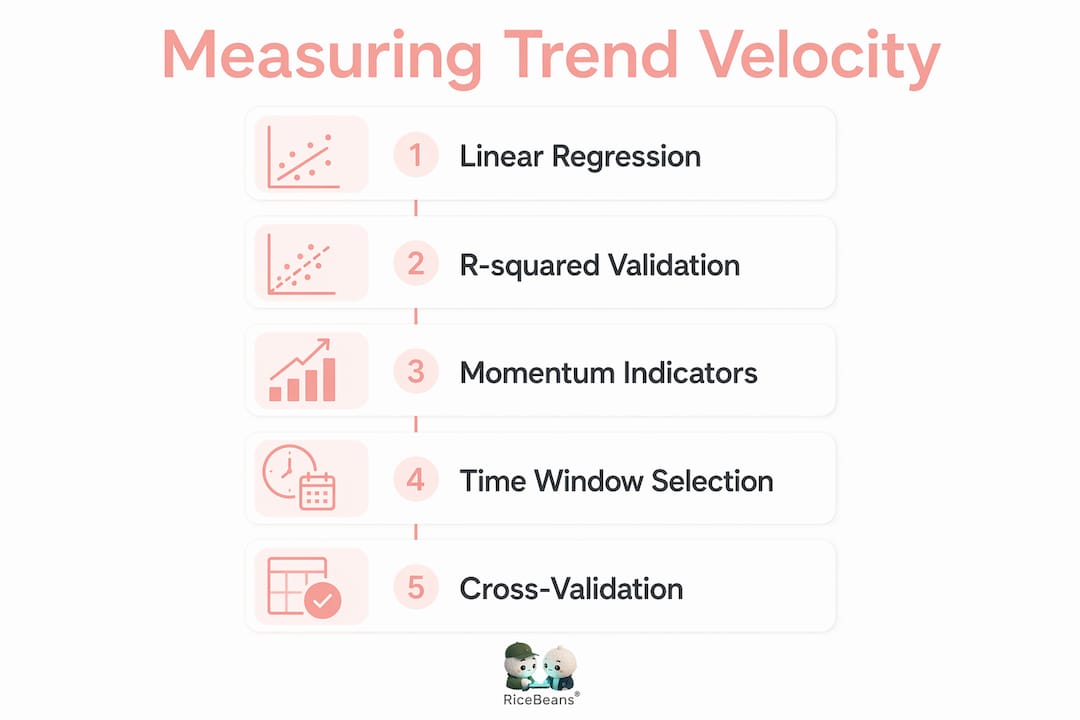
Measuring trend velocity requires more than plotting a line on a chart. The most reliable method combines linear regression with momentum indicators to confirm both direction and rate of change.
Linear regression and R-squared
An R-squared value above 0.70 from linear regression confirms a consistent and meaningful trend velocity. Below 0.30, the data is mostly noise. This threshold gives analysts a clear binary: act on the signal or discard it. Running a regression requires at least 5–6 data points, with 10–12 preferred for statistical reliability.
Momentum indicators
The Rate of Change (ROC) indicator measures the percentage difference between the current value and a value from a set number of periods ago. Momentum measures difference in points; ROC is percentage-based and easier to compare across instruments. The Accelerator Oscillator acts as a market speedometer, highlighting shifts in momentum before price changes occur. This gives analysts a second layer of confirmation before committing to a directional call.
Time window selection
Velocity metrics are calibrated using specific time windows: 10–14 periods for short-term analysis, and 15–30 second windows for high-frequency contexts. Choosing the wrong window distorts the signal. A 90-day window smooths out the very acceleration patterns that make velocity useful.
| Metric | Type | Best use case |
|---|---|---|
| R-squared (linear regression) | Directional validation | Confirming trend reliability |
| Rate of Change (ROC) | Momentum percentage | Cross-instrument comparison |
| Accelerator Oscillator | Momentum shift detection | Early reversal warning |
| Time window (10–14 periods) | Short-term calibration | Fast-moving market contexts |
Pro Tip: Always validate your velocity signal with at least two independent indicators before acting. A strong ROC reading paired with an R-squared above 0.70 is a far more reliable signal than either metric alone.
Velocity vs speed, momentum, and volume: what is the difference?
These four terms are frequently conflated, and the confusion leads to poor analytical decisions.
Velocity versus speed
Speed measures magnitude only: how much a trend has moved. Velocity adds direction to that magnitude. A trend moving rapidly downward has high speed and negative velocity. Treating these as synonymous causes analysts to misread bearish acceleration as bullish strength.
Velocity versus momentum
Momentum measures the rate of change of velocity itself. It is the acceleration layer. A trend can have high velocity but declining momentum, which signals that the current direction is losing energy. Combining velocity with momentum and directional confirmation filters noise and increases reliability in volatile markets. Momentum is the early warning; velocity is the confirmation.
Velocity versus volume
Volume is a quantity-based, lagging indicator. It tells you how much activity occurred, not whether that activity is building or fading. Traditional volume metrics lag actual market moves and miss the dynamic energy that velocity captures. A high-volume trend that is decelerating is far less valuable than a lower-volume trend with accelerating velocity.
| Metric | Measures | Leading or lagging | Strategic value |
|---|---|---|---|
| Velocity | Speed and direction | Leading | Predicts trend health |
| Speed | Magnitude only | Neutral | Limited without direction |
| Momentum | Rate of velocity change | Leading | Early reversal signal |
| Volume | Quantity of activity | Lagging | Confirms past moves |
The practical implication is direct: volume confirms what already happened, while velocity and momentum signal what is about to happen. Analysts who prioritise velocity over volume gain a structural timing advantage over those relying on retrospective data.
Why does trend velocity matter for business strategy?
The strategic value of trend velocity sits in its predictive power. Trend velocity reveals strength or exhaustion ahead of directional changes, serving as an early warning before reversals occur. For a business analyst, this means identifying when a product category is gaining genuine traction versus when it is simply generating noise.
Consider three practical scenarios:
-
Market entry timing. A sector showing high velocity with rising momentum signals an early-stage trend worth entering. The same sector with high volume but decelerating velocity signals a trend approaching saturation. Entering at that point means competing at peak cost for diminishing returns.
-
Product launch decisions. Launching against a high-velocity trend in AI tools or green energy, for example, means your content, marketing, and product positioning align with rising demand. Launching against a high-volume but low-velocity trend means you are entering a crowded, slowing market.
-
Content and SEO strategy. AI-driven search and Generative Engine Optimisation rely on velocity for early trend capture to secure traffic and citations. Publishing content aligned with an accelerating trend captures compounding search demand. Waiting for volume confirmation means publishing after the peak.
The zero-hour advantage is the clearest argument for velocity. Relying solely on volume tools that aggregate data over 30 to 90 days means the early signal is already gone by the time you act. Velocity detects trends as they form, not after they have already shaped the market.
Pro Tip: Track velocity signals across multiple sectors simultaneously using an AI-powered platform. A single-sector view misses cross-market acceleration patterns that often precede the largest strategic opportunities.
How to assess and apply trend velocity metrics effectively
Applying velocity metrics well requires a disciplined process. The following steps reflect best practice for analysts working across financial, technology, and consumer markets.
-
Select your time window deliberately. Match the window to the market's natural tempo. High-frequency trading contexts demand 15–30 second windows. Strategic business analysis works best with 10–14 period windows. Using a 90-day window for a fast-moving AI sector will smooth away the very signals you need.
-
Validate with R-squared before acting. Run linear regression on your trend data and confirm the R-squared value exceeds 0.70. Below that threshold, the apparent trend is statistically unreliable. This single step eliminates a large proportion of false signals.
-
Layer momentum on top of velocity. A velocity signal without momentum context is incomplete. Use the ROC indicator or Accelerator Oscillator to confirm whether the trend is accelerating or losing energy. A decelerating velocity signal is a warning, not an entry point.
-
Monitor across multiple timeframes. Monitoring tempo across multiple timeframes helps detect structural weaknesses before visible trend breaks occur on higher-level charts. A trend that looks strong on a weekly view may be decelerating sharply on a daily view.
-
Avoid mistaking noise for signal. The most common pitfall is acting on short-term spikes without regression validation. Viral events, news cycles, and seasonal anomalies all create velocity-like patterns that collapse quickly. R-squared validation and multi-indicator confirmation are your filters.
Understanding how indicators help time the market is the practical complement to velocity theory. The combination of validated direction, confirmed momentum, and appropriate time windows is what separates reliable signals from expensive mistakes.
Pro Tip: Build a cross-timeframe tempo alignment check into your regular analysis routine. When short, medium, and long-term velocity signals all point in the same direction, the probability of a sustained trend is significantly higher.
Key takeaways
Trend velocity is the leading indicator that separates early market movers from those reacting to data that is already priced in.
| Point | Details |
|---|---|
| Velocity beats volume | High velocity with low volume predicts market shifts better than high volume with low velocity. |
| Validate with R-squared | An R-squared above 0.70 confirms a real directional trend; below 0.30 signals noise to discard. |
| Layer momentum confirmation | Combine ROC or Accelerator Oscillator with velocity to detect acceleration and early reversals. |
| Match time windows to context | Use 10–14 period windows for strategy; 15–30 second windows for high-frequency analysis. |
| Zero-hour advantage is time-sensitive | Volume tools aggregating 30–90 days of data eliminate the early signal before you can act on it. |
Velocity in practice: what I have learned from the signals
I have spent years watching analysts make the same mistake: they wait for volume confirmation before acting, then wonder why they are always a step behind. Volume is comfortable. It feels like certainty. But by the time volume confirms a trend, the most profitable entry point has already passed.
The most revealing moments in my experience have come from watching high-velocity, low-volume signals in emerging technology sectors. These signals looked insignificant by volume standards. They were accelerating sharply by velocity standards. The analysts who acted on velocity were positioned before the mainstream wave arrived. Those who waited for volume were competing at the peak.
The misunderstanding I encounter most often is treating velocity and momentum as interchangeable. They are not. Velocity tells you the trend's current direction and speed. Momentum tells you whether that velocity is building or fading. A trend with high velocity and declining momentum is a trap. It looks strong on the surface and is losing energy underneath.
The shift towards AI-driven market intelligence has made velocity analysis more accessible and more urgent simultaneously. Platforms that surface real-time trend signals are no longer a luxury for large trading desks. They are the baseline for any analyst who wants to operate ahead of the curve rather than behind it. My advice is direct: build velocity metrics into your standard analysis routine now, before your competitors do.
— Aidil
Track trend velocity before your competitors do
Ontherice is built specifically for analysts and business professionals who need to act on trends before they reach mainstream awareness. The platform's AI engines scan global data points in real time, extract meaningful signals from noisy markets, and produce velocity-weighted rankings across sectors.

If you are serious about capturing the zero-hour advantage, the AI opportunities tracker on Ontherice surfaces accelerating trends with velocity and momentum scores before they appear in standard volume-based tools. You can also explore the rankings generator engine to see dynamic rankings built on the latest trend velocity and market momentum data. Stop reading markets in retrospect. Start reading them as they form.
FAQ
What is trend velocity in simple terms?
Trend velocity is the measure of how fast a trend is moving and in which direction. It combines speed with directional context, making it a leading indicator rather than a lagging one.
How does trend velocity differ from trend acceleration?
Trend velocity measures the current speed and direction of a trend. Trend acceleration, often captured by momentum indicators like the ROC or Accelerator Oscillator, measures whether that velocity is increasing or decreasing.
What R-squared value confirms a reliable trend velocity?
An R-squared value above 0.70 from linear regression confirms a consistent and meaningful trend velocity. Values below 0.30 indicate the data is predominantly noise rather than a real directional signal.
Why do volume metrics miss early trend signals?
Volume aggregates past activity and typically lags actual market moves by 30–90 days. Velocity captures the energy and direction of a trend as it forms, giving analysts a structural timing advantage over volume-only approaches.
How many data points are needed to measure trend velocity accurately?
A minimum of 5–6 data points is required to run a regression, but 10–12 data points are preferred to achieve statistical reliability and confirm that the velocity signal is genuine rather than incidental.