
Real-time market intelligence is the continuous collection and near-instant analysis of live data streams (social posts, pricing feeds, transaction logs, web signals) to surface decision-ready alerts within minutes rather than weeks. It matters because acting on a signal today beats acting on last month's report, whether that means repricing a product or catching a reputational problem before it spreads. Platforms apply AI models to noisy live data specifically to compress that lag into something a team can act on immediately.
TL;DR:
- Real-time market intelligence reduces response time from weeks to minutes by continuously analyzing live data streams with AI models, enabling immediate action.
- Key sources include social media, news feeds, financial data, transaction telemetry, IoT sensors, and APIs, which require appropriate ingestion and enrichment methods.
- Implementing effective systems involves defining specific decisions, choosing suitable sources, building pipelines, and embedding insights into existing tools, starting small.
- Ensuring signal trustworthiness requires rigorous data governance, deduplication, provenance tracking, and clear ownership to prevent noise and bias from misleading decisions.
- Platforms like Ontherice rank and explain signals with transparency, helping users calibrate alerts and integrate real-time insights into various workflows for faster, better decisions.
Table of Contents
- What is real-time market intelligence, and how does it differ from traditional research?
- Why does real-time market intelligence matter for business decisions?
- Where does real-time market data actually come from?
- How do AI and streaming analytics turn raw data into usable signals?
- How do you actually implement real-time market intelligence?
- What does real-time market intelligence look like in practice?
- How do you keep real-time signals trustworthy?
- How does a platform like Ontherice approach this in practice?
- Where does Ontherice fit into your own workflow?
- Sources
What is real-time market intelligence, and how does it differ from traditional research?
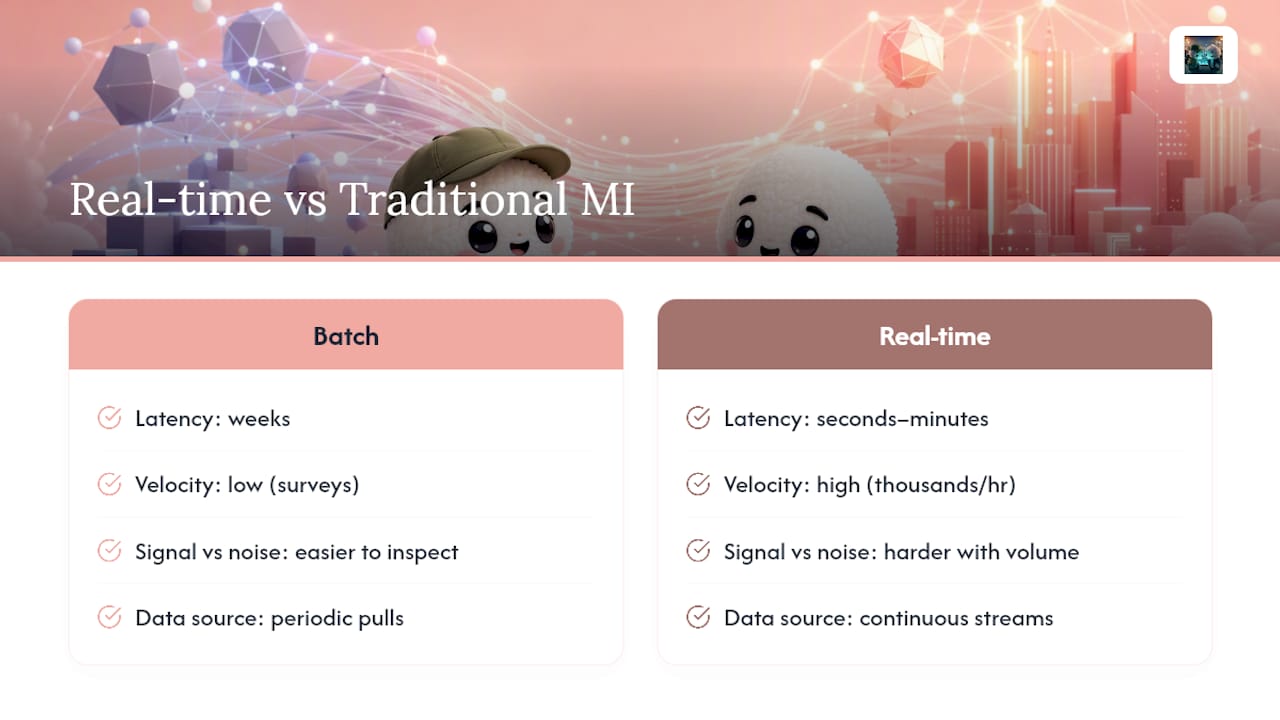
Real-time market intelligence is the practice of ingesting live data streams and analysing them continuously, so that a shift in price, sentiment, or demand shows up as an alert within minutes of happening rather than in next quarter's report. Traditional market intelligence works in batches: a research team pulls data, cleans it, writes it up, and delivers findings weeks or months after the underlying event occurred. By the time a competitor's pricing move or a viral complaint reaches a quarterly briefing, the moment to respond has usually passed.
Three technical distinctions separate the two approaches. Latency is the gap between an event happening and a signal reaching a decision-maker. In batch research this can run to weeks; in a properly built real-time pipeline it drops to seconds or minutes. Velocity refers to how fast new data arrives and needs processing. A newswire feed or a live pricing API generates thousands of updates an hour, which traditional survey-based research was never designed to handle. Signal versus noise describes the analytical challenge of separating a genuine shift from random fluctuation, which becomes harder as data volume and speed increase.
The terminology matters because vendors use it loosely. A "feed" is any continuous data source; a "stream" is the live flow itself; a genuine signal is a pattern confident enough to justify a decision.
Why does real-time market intelligence matter for business decisions?
Speed to act is the whole point. A pricing team that sees a competitor's discount within the hour can match it before losing share; a team that finds out at month-end has already lost the sale. The same logic applies across functions: competitive monitoring catches a rival's product launch as it happens, dynamic pricing engines adjust to demand spikes in real time, risk teams flag reputational events before they trend, and marketing teams reallocate ad spend mid-campaign rather than after it ends.
Organisations that are highly data-driven are roughly three times more likely to report significant improvements in decision-making quality than those that aren't, according to a survey of over 1,000 senior executives.
That gap tends to widen further when the data itself is live rather than historical, because the decision and the evidence sit closer together in time. IBM frames this as the core value of streaming analytics and event processing: immediate insight for use cases like fraud detection and inventory management, where a delay of even a day can mean the damage is already done. Companies adopting modern analytics dashboards also report measurable revenue and operational gains, though the size of that uplift depends heavily on how well the organisation acts on what it sees, not just how much data it collects.
Where does real-time market data actually come from?
Real-time signals come from a mix of public streams and proprietary telemetry, and most organisations end up combining several source types rather than relying on one.
- Social streams — public posts, comments and engagement metrics that reveal sentiment shifts as they happen.
- Newswire and web feeds — press releases, filings and scraped web pages that flag announcements or price changes.
- Financial tick data — second-by-second price and volume data from markets, the kind TradingView surfaces through its charting and community commentary.
- Transaction telemetry — a company's own point-of-sale, e-commerce or app data, showing demand as it forms.
- IoT sensors — physical-world data such as foot traffic, temperature, or equipment status feeding into supply-chain decisions.
- APIs and webhooks — the plumbing that most other sources rely on to push updates rather than wait to be polled.
Ingestion generally follows one of a few patterns: streaming APIs that push continuous updates, webhook callbacks triggered by specific events, publish/subscribe architectures that fan data out to multiple consumers, and change-data-capture systems that watch a database for updates rather than re-querying it. Once raw data arrives, enrichment turns it into something usable. Natural language processing extracts named entities and sentiment from text; geolocation tags where an event happened; deduplication removes the dozens of near-identical mentions a single event tends to generate across platforms.
Pro Tip: Before connecting any new social or web source, check its terms of service for scraping and redistribution limits. A signal that's technically accurate but sourced in breach of a platform's terms creates legal exposure that outweighs whatever competitive edge it gives you.
Legal and ethical considerations aren't a footnote here. Regulated industries face extra constraints around personal data in transaction or telemetry feeds, and any pipeline touching consumer data needs a clear retention and consent policy before it goes live.
How do AI and streaming analytics turn raw data into usable signals?
Converting a live feed into something a decision-maker can trust follows a recognisable pattern, the same one that applies to traditional analytics but compressed into much tighter timeframes. Tableau's framework describes it as four layers: descriptive (what happened), diagnostic (why it happened), predictive (what's likely next), and prescriptive (what to do about it). Applying that layering to streaming data demands lower-latency pipelines and constant monitoring, because a model that took an hour to run on yesterday's batch has to run in seconds on today's stream.
Specific techniques do the heavy lifting at each layer:
- NLP for sentiment and entity extraction turns unstructured text (reviews, posts, transcripts) into structured signals about who is being discussed and how.
- Anomaly and change-point detection flags when a metric moves outside its expected range, the technique behind most fraud alerts and sudden-demand-spike warnings.
- Real-time scoring models rank incoming signals by likely relevance or urgency, so a human isn't reviewing thousands of raw events.
- Ensemble methods combine several models' outputs to reduce the false-positive rate any single model would produce alone.
None of this works without confidence scoring and explainability attached to every alert. Human-in-the-loop verification remains essential at this stage: AI can surface and rank candidates far faster than any analyst, but a person should confirm anything that triggers a costly action.
How do you actually implement real-time market intelligence?
Implementation works best as a staged rollout rather than an all-at-once platform switch. Each stage builds the foundation the next one needs.
- Define the decisions first. Before choosing a single data source, list the specific decisions the system needs to support (repricing, campaign shifts, risk escalation) and set measurable success criteria for each.
- Choose sources and ingestion architecture. Match source types to those decisions, negotiate data contracts where needed, and pick an ingestion pattern (streaming API, webhook, pub/sub) suited to the volume and urgency involved.
- Build the pipeline. This covers cleaning, enrichment (entity extraction, deduplication, geolocation) and the analytical models, ideally ones that expose their reasoning rather than acting as black boxes.
- Surface the insight where work happens. An alert buried in a dashboard nobody opens is worthless; embed it into the tools teams already use, whether that's a Slack channel, a CRM record or a pricing engine.
- Measure, govern and iterate. Track whether alerts actually changed a decision, tighten thresholds that generate too much noise, and review data governance regularly as sources and regulations shift.
Pro Tip: Start with one narrow, high-value alert (a sudden price move, a spike in negative mentions) rather than a broad dashboard covering everything. It's far easier to prove value and refine thresholds on one use case than to tune ten at once.
Coursera's research on data-driven decision-making makes the same point from a different angle: clean data and governance matter as much as the tools themselves, and skipping straight to stage three without defining stage one's success criteria is the most common reason these projects stall. Readers building a fuller rollout plan can work through Ontherice's step-by-step market intelligence guide for the longer version of this playbook.
What does real-time market intelligence look like in practice?
The clearest way to see the value is across four functions doing very different jobs with the same underlying capability.
- Sales and competitive monitoring: a rival drops its price significantly at 9am, and the pricing team sees the change and adjusts before midday rather than at the next weekly review.
- Marketing: a campaign's engagement drops sharply within hours of launch, prompting a creative swap instead of waiting until the post-campaign report to learn it underperformed.
- Operations and supply chain: a sudden spike in regional demand triggers an early reorder, avoiding a stockout that a monthly inventory check would have caught too late.
- Risk and compliance: a cluster of negative mentions referencing a specific product batch surfaces hours before it would have reached a formal complaint log, giving the team a head start on the response.
Ontherice's collection of real-world data-driven examples walks through several comparable cases in more depth, and its guide to real-time trend insights covers how some of these signals were verified before teams acted on them, which matters more than the alert itself.
How do you keep real-time signals trustworthy?
The biggest risk in real-time market intelligence isn't missing a signal. It's acting on one that turns out to be noise, bias, or a duplicate of something already seen three times under different names.
- Duplication and sampling bias inflate apparent significance; the same event mentioned by twenty accounts can look like twenty separate signals if deduplication isn't built in.
- Source bias skews results when one platform or demographic dominates a feed, making a niche reaction look like a market-wide trend.
- Provenance matters more than volume. Every alert should link back to its original evidence (the actual post, filing, or transaction) and a short note on why it was surfaced, so anyone reviewing it can verify rather than just trust.
That auditable trail is what separates a genuinely useful signal from a plausible-looking one. ThoughtSpot's research on data-driven organisations notes that the revenue and efficiency gains from analytics adoption depend heavily on data quality and governance discipline, not just tool sophistication.
Organisations that treat data quality as seriously as data speed see roughly three times the improvement in decision quality reported by less disciplined ones.
Readiness isn't just technical. Someone needs clear ownership of each alert type, a documented escalation path for high-confidence signals, and a baseline of data literacy across the team using the system, echoing the governance point Ontherice's market intelligence trends analysis makes about organisational readiness lagging behind tool adoption. A less obvious risk sits in due diligence and deal contexts specifically, where AddBack's work on pre-deal intelligence shows how the same provenance discipline applies before a transaction closes, not just after a market event occurs.
How does a platform like Ontherice approach this in practice?
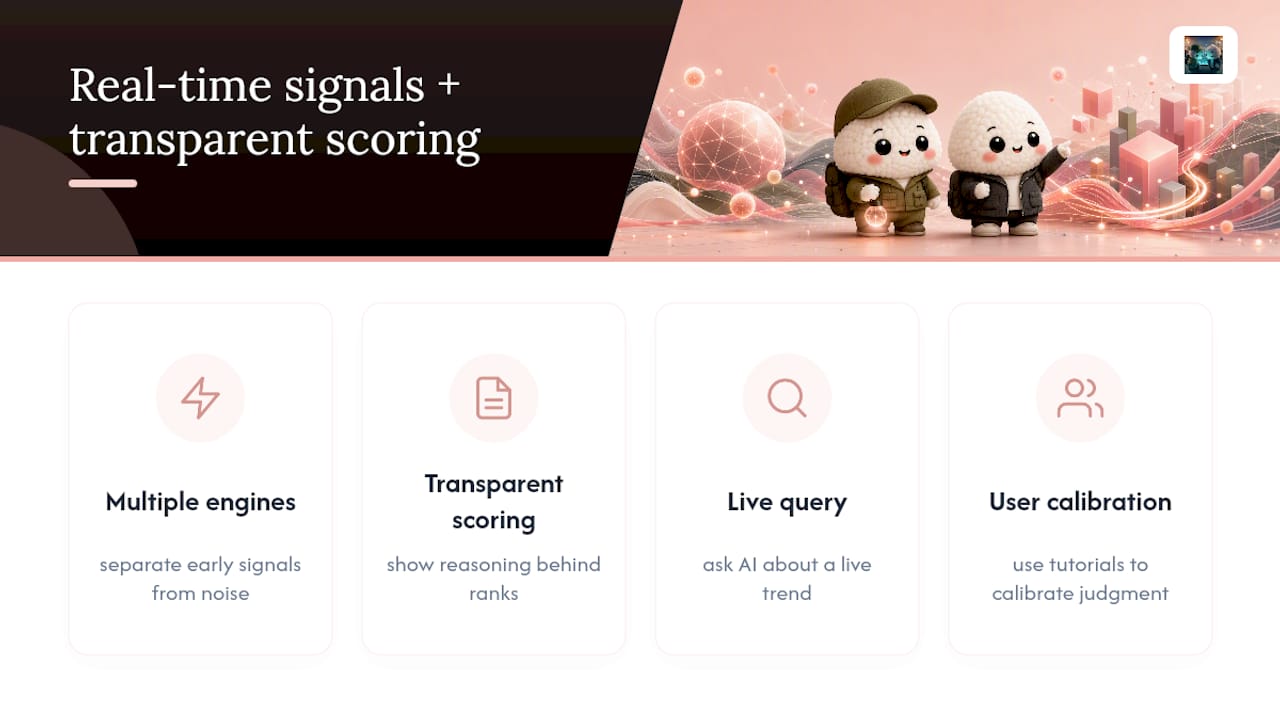
Some platforms run multiple AI engines against noisy global data specifically to separate a genuine early signal from background chatter, then score and rank what they find so the reasoning behind a ranking is visible rather than hidden. That transparency matters more than the ranking itself: a score with no visible basis is just another number to distrust. Some platforms also let users query live AI directly about a trend or signal, rather than waiting for a static report to catch up with what's already moved.
None of this replaces judgement. A signal ranked highly today can shift by tomorrow, and no AI model catches every early move in every sector. Readers experimenting with the platform's tutorials and exploration tools should treat early sessions as a way to calibrate their own sense of which signals in their sector tend to hold up, and which turn out to be noise. That calibration, done honestly, is worth more than any single ranking.
Where does Ontherice fit into your own workflow?
If the sections above made one thing clear, it's that most of the hard work in real-time market intelligence isn't collecting data, it's separating signal from noise fast enough to act on it. That's the specific gap Ontherice.org is built to close: AI engines that scan global data continuously and surface ranked, scored signals across finance, products, technology, crypto, jobs and brands, with the reasoning behind each ranking kept visible rather than buried.
The platform's AI-discovered opportunities feed is the fastest way to see this in action: live signals scored and ranked as they emerge, rather than compiled after the fact. Readers who want to understand the mechanics behind a score can check the ranking methodology page, which lays out how transparency is built into the system rather than bolted on. For a first step, run one live query against a sector you already know well and compare what Ontherice surfaces against your own instinct. That comparison, more than any feature list, will tell you whether the tool earns a place in your workflow.
Sources
For readers who want the underlying research behind this guide, HBS Online's analysis of data-driven decision-making lays out the executive survey data referenced above. IBM's explainer covers streaming analytics and event processing in more technical depth, useful for teams scoping architecture. Coursera's guide focuses on the organisational side, particularly data literacy and governance. Tableau's framework on descriptive-to-prescriptive analytics is worth bookmarking for anyone designing an analytics stack from scratch.
- The Advantages of Data-Driven Decision-Making | HBS Online
- Data-Driven Decision Making: Make Informed Decisions | Coursera
- What Is Data-Driven Decision-Making? | IBM
- Data-Driven Decision Making: Best practices | ThoughtSpot