
TL;DR:
- Strategic inflection points involve sudden shifts in competitive forces that require fundamental strategy changes. Leaders must detect early weak signals, such as cultural drift and KPI volatility, to respond proactively before financial damage appears. Actively monitoring the second derivative of growth and maintaining frequent reviews enables organizations to navigate these pivotal moments successfully.
A strategic inflection point is a profound shift in the forces shaping a business environment that fundamentally alters competitive dynamics and demands a change in strategy. Andy Grove, former CEO of Intel, coined the term to describe moments when a 10x change in competitive forces rewrites the rules of an industry entirely. Rita McGrath at Columbia Business School extended this thinking, arguing that competitive advantage is now transient and that leaders must continuously scan for these pivotal moments. Missing one does not merely slow growth. It typically triggers organisational decline that becomes irreversible within a few years.
Defining strategic inflection points accurately is the first discipline of sound strategic decision making. These are not ordinary market fluctuations or quarterly dips in revenue. They represent a structural break: the moment when the old playbook stops working and a new one must be written from scratch. The consequences of misreading them are severe, which is why the frameworks for identifying inflection points have become central to modern competitive strategy.

What are the early signals of a strategic inflection point?
Strategic inflection points are not random. They are the final, visible phase of a slow, subtle process that builds over months or years. Leaders who spot them early do so by tracking weak signals, not waiting for financial damage to confirm what they already suspected.
Organisational failures around business inflection points follow a predictable timeline. Leadership drift becomes visible 12–24 months before the inflection fully materialises. Cultural signals, such as suppressed bad news and declining candour in senior meetings, appear 6–18 months prior. Execution breakdowns follow 6–12 months before any P&L damage shows up in the accounts.
The most dangerous strategic change indicators are the quiet ones. Strong signals visible in lagging financials appear too late for a timely response. Leaders who rely solely on quarterly results to detect change are, in effect, driving by looking in the rear-view mirror.
Practical early warning signs include:
- Leadership drift: Senior teams begin avoiding difficult conversations and defaulting to consensus.
- Cultural suppression: Bad news stops travelling upward, and dissenting voices are quietly sidelined.
- KPI volatility: Widening performance swings in operational metrics precede visible financial damage by 6–12 months.
- Peripheral signals: Customers in adjacent markets or fringe segments start behaving differently before the core market shifts.
- Execution friction: Familiar tactics stop producing familiar results despite correct implementation.
Pro Tip: Track leading indicators weekly and lagging indicators monthly. If your review cadence is entirely backwards-looking, you will always be responding to history rather than shaping the future.
How does the second derivative explain inflection points?
The calculus metaphor is the sharpest conceptual tool for understanding what a strategic inflection point actually is. In mathematics, the second derivative measures the rate of change of the rate of change. A business inflection point is precisely that: the moment when the rate of change itself changes, shifting from acceleration to deceleration or vice versa.
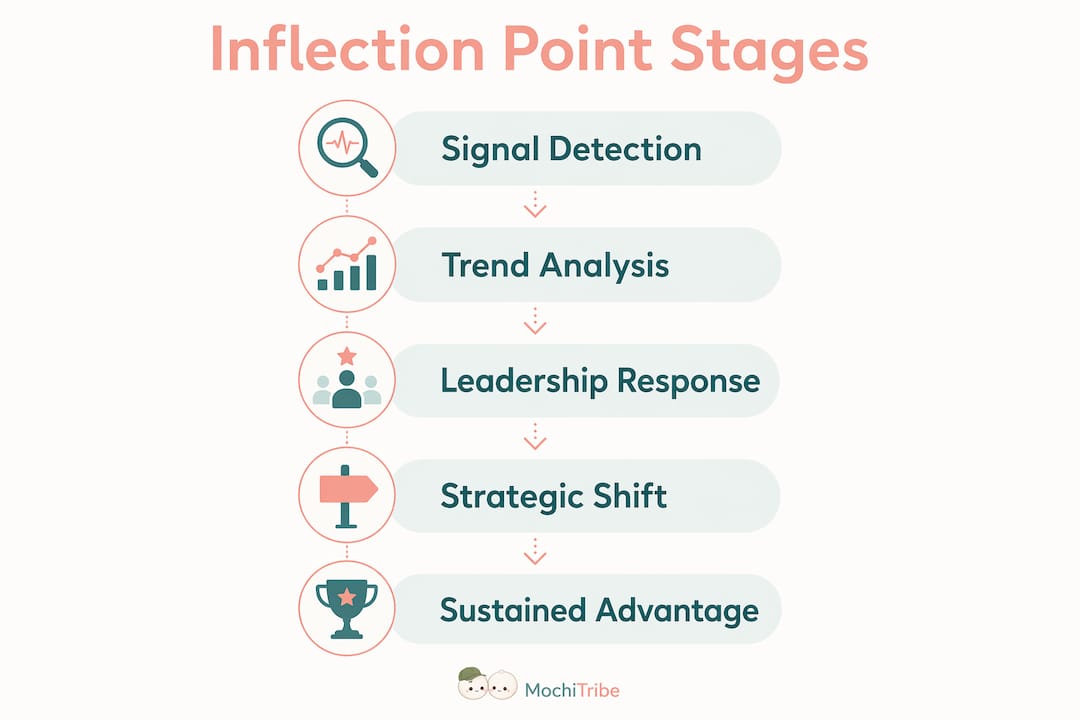
This distinction matters enormously for strategic decision making. Most leaders track the level of a metric, such as revenue or market share. The inflection point lives one layer deeper, in the curvature of the growth curve. By the time the level changes direction, the inflection has already passed.
Consider two contrasting scenarios:
- Positive inflection: A technology adoption curve that was growing slowly suddenly steepens. The rate of growth accelerates. Leaders who act at this moment capture disproportionate market share before competitors recognise the shift.
- Negative inflection: A mature market that appeared stable begins decelerating. Revenue still grows, but the rate of growth slows. Leaders who miss this signal continue investing in a model that is quietly losing momentum.
The risk of misapplying growth models compounds this challenge. Applying a linear model to an exponential change is the leading cause of competitive failure at inflection moments. A market growing exponentially looks modest in its early stages when viewed through a linear lens. By the time the exponential curve becomes obvious, the window for a first-mover response has closed.
| Change model | What leaders see | What is actually happening |
|---|---|---|
| Linear | Steady, predictable growth | Misses acceleration or deceleration |
| Exponential | Slow start, then sudden surge | Early stages appear insignificant |
| S-curve | Rapid growth then plateau | Plateau signals the next inflection |
Pro Tip: Plot your core metrics on a logarithmic scale quarterly. Exponential change becomes a straight line on a log chart, making acceleration and deceleration far easier to spot early.
What KPIs and methods track strategic inflection points effectively?
Measurement is where most organisations fail when navigating strategic transitions. The instinct is to measure everything or to measure infrequently. Both approaches destroy signal quality.
Effective management of inflection points uses a hierarchy of KPIs: leading metrics tracked weekly, adoption metrics tracked fortnightly in the initial months, and impact metrics tracked monthly after implementation. Tracking too infrequently misses emerging trends. Tracking too frequently generates noise that obscures the genuine signal. Best practice uses 2–3 metrics per level, not a sprawling dashboard of thirty indicators.
Practical KPIs worth monitoring include:
- Manager engagement scores: Decline here precedes broader cultural breakdown by several months.
- Process compliance rates: Slippage in compliance signals that teams are reverting to old habits under pressure.
- Customer satisfaction trends: Not the absolute score, but the direction and rate of change over rolling quarters.
- Initiative load per team: Overloaded teams cannot absorb change, which is a structural readiness problem, not a motivation one.
Survey-based sentiment analyses fail to capture true organisational readiness. Effective assessment focuses on operational data measuring capacity and initiative load. An organisation that scores well on attitude surveys but carries three times its optimal change load will fail at the inflection regardless of stated willingness.
Andy Grove's practice of monthly paranoia reviews offers a practical leadership ritual. These structured sessions systematically evaluate changes in technology, regulation, and customer behaviour. The goal is to commit early to new paths before lagging data makes the decision obvious to everyone, including competitors.
Pro Tip: Build a simple signal register: a shared document updated monthly that logs weak signals from peripheral markets, customer complaints, and competitor behaviour. Patterns emerge faster when signals are written down and reviewed collectively.
For a structured approach to monitoring industry momentum, consistent KPI hierarchies provide the backbone that prevents reactive, crisis-driven responses.
How do businesses apply inflection point insights to sustain advantage?
The hardest part of navigating a strategic inflection is not identifying it. It is committing to a new direction before the evidence is conclusive. Leaders succeed by acting on incomplete information, committing before the inflection curve fully turns. Waiting for certainty is, in almost every documented case, waiting too long.
Grove described the necessary leadership posture as "let chaos reign, then rein it in." The first phase demands broad experimentation: multiple bets placed across possible futures. The second phase demands decisive convergence once the new trajectory becomes clear enough to commit to. Leaders who skip the first phase miss the learning. Those who never execute the second phase dissipate resources without building a new position.
The death of the traditional billable hour in professional services illustrates this precisely. AI systems disrupting time-based value measurement are forcing law firms, consultancies, and accountancy practices toward value-based pricing models. Firms that recognised this as a genuine inflection point, rather than a passing technology trend, began restructuring their service models years before the financial pressure became acute.
The biggest barrier to navigating inflection points is psychological resistance to letting go of old business rules. The data rarely tells you to change. The weak signals do. Leaders who build the discipline to act on weak signals before strong ones confirm them are the ones who define the next competitive era, not merely survive it.
Sustaining advantage through an inflection requires three deliberate shifts:
- Mental model update: Replace linear extrapolation with scenario thinking. Ask what the world looks like if the rate of change doubles, not just if the trend continues.
- Resource reallocation: Move budget and talent toward the emerging trajectory before the old model stops generating returns. This feels premature. It rarely is.
- Organisational agility: Build teams that can run experiments quickly, read results honestly, and spot new business opportunities without waiting for executive permission at every step.
The importance of strategic inflection lies not in predicting the future with precision, but in building the organisational capacity to respond faster than competitors when the curve turns.
Key takeaways
Strategic inflection points are detectable before they become obvious, and the leaders who act on weak signals before lagging data confirms the shift are the ones who define the next competitive era.
| Point | Details |
|---|---|
| Act on the second derivative | Monitor the rate of change, not just the level, to catch inflections before they become visible in financials. |
| Track a KPI hierarchy | Use leading metrics weekly, adoption metrics fortnightly, and impact metrics monthly for clean signal detection. |
| Weak signals precede strong ones | Cultural drift and KPI volatility appear 6–24 months before financial damage confirms a structural shift. |
| Commit before certainty | Acting on incomplete information is not reckless. Waiting for conclusive data is almost always too late. |
| Paranoia reviews build agility | Monthly structured reviews of technology, regulation, and customer behaviour keep leadership ahead of the inflection curve. |
What I have learned about inflection points that most articles miss
The conventional advice on recognising inflection points focuses almost entirely on external signals: market data, competitor moves, technology shifts. In my experience, the most reliable early warning system is internal. The moment a leadership team stops arguing and starts agreeing on everything, something has gone wrong. Consensus in the face of genuine uncertainty is not alignment. It is avoidance.
The second thing most frameworks understate is the problem of false inflections. Not every disruption is a 10x shift. Some are genuine threats; others are noise dressed up as transformation. The discipline is in distinguishing between the two without either dismissing real signals or panicking at every new technology announcement. Building a signal register and reviewing it monthly with a sceptical eye is the most practical tool I have found for making that distinction.
The psychological resistance that Grove identified is real and underestimated. Leaders who built careers on a particular business model find it genuinely difficult to accept that the model is breaking. The data never tells you to change. The weak signals do. Developing the habit of listening to those signals, even when they are uncomfortable and unconfirmed, is the single most valuable capability a leadership team can build.
— Aidil
Ontherice: real-time signals for strategic decision making
Identifying an inflection point in theory is one thing. Seeing it in your own market data, in real time, is another.

Ontherice scans global data points across sectors to surface the weak signals that precede major market shifts. The platform's traffic monitoring tools give you a live view of momentum changes across markets, so you can track the leading indicators that matter before they show up in competitor press releases. For leaders who want structured KPI visibility, the Google Analytics Dashboard integrates real-time data with the kind of trend monitoring that makes paranoia reviews genuinely productive. When the inflection curve starts to turn, Ontherice gives you the data to see it first.
FAQ
What is a strategic inflection point?
A strategic inflection point is a moment when a 10x change in competitive forces fundamentally alters the rules of an industry, requiring a complete shift in strategy. Failure to recognise and respond to it typically leads to organisational decline.
How early can you detect a strategic inflection point?
Leadership drift and cultural signals can appear 12–24 months before an inflection fully materialises. KPI volatility in operational metrics often precedes visible financial damage by 6–12 months.
What is the difference between a leading and a lagging indicator?
A leading indicator changes before the business outcome it predicts, giving early warning of a shift. A lagging indicator confirms what has already happened, making it useful for measurement but too slow for timely strategic response.
Why do businesses miss strategic inflection points?
The most common cause is applying a linear growth model to what is actually an exponential or structural change. Psychological resistance to abandoning a successful business model compounds the problem, causing leaders to dismiss early signals as noise.
How often should businesses review strategic change indicators?
Leading KPIs warrant weekly review, adoption metrics fortnightly, and impact metrics monthly. Monthly paranoia reviews that assess technology, regulation, and customer behaviour changes provide the broader strategic scanning layer.