
TL;DR:
- Tracking adoption catalysts helps teams identify early signs of product success or failure, allowing timely interventions. Advanced teams use multiple AI-driven metrics to monitor user behavior and optimize decision-making. Focusing on outcome metrics and regular reviews improves ROI and prevents resource waste in product development.
Adoption catalysts are defined as the measurable factors that accelerate the uptake of new products, features, or technologies within a market. Knowing why track adoption catalysts matters is not a theoretical exercise. It is a financial and competitive necessity. Features with only 3% adoption signal early failure, while those reaching 45% adoption justify continued investment. The gap between those two numbers represents wasted engineering time, misallocated budgets, and missed market windows. Tracking these catalysts gives business professionals the early intelligence to act before losses compound.
Why track adoption catalysts across your product portfolio?
Adoption catalysts are the forces that move a product from trial to habit. They include regulatory shifts, pricing changes, community momentum, and the presence of early advocates who pull others into adoption. Tracking them is the discipline of monitoring which forces are active, how strong they are, and whether they are accelerating or fading.

The importance of tracking adoption sits at the intersection of product management and market intelligence. Without it, teams rely on intuition or internal lobbying to decide what to build next. With it, they can prioritise based on adoption data rather than opinion, shifting engineering resources toward higher-impact work.
For strategists operating in impact investing, the stakes are equally high. Catalytic capital, the type of funding designed to mobilise private investment in underserved markets, requires rigorous tracking to balance risk and societal impact. That principle applies equally to product adoption: without measurement, you cannot manage.
What metrics and indicators measure adoption catalysts effectively?
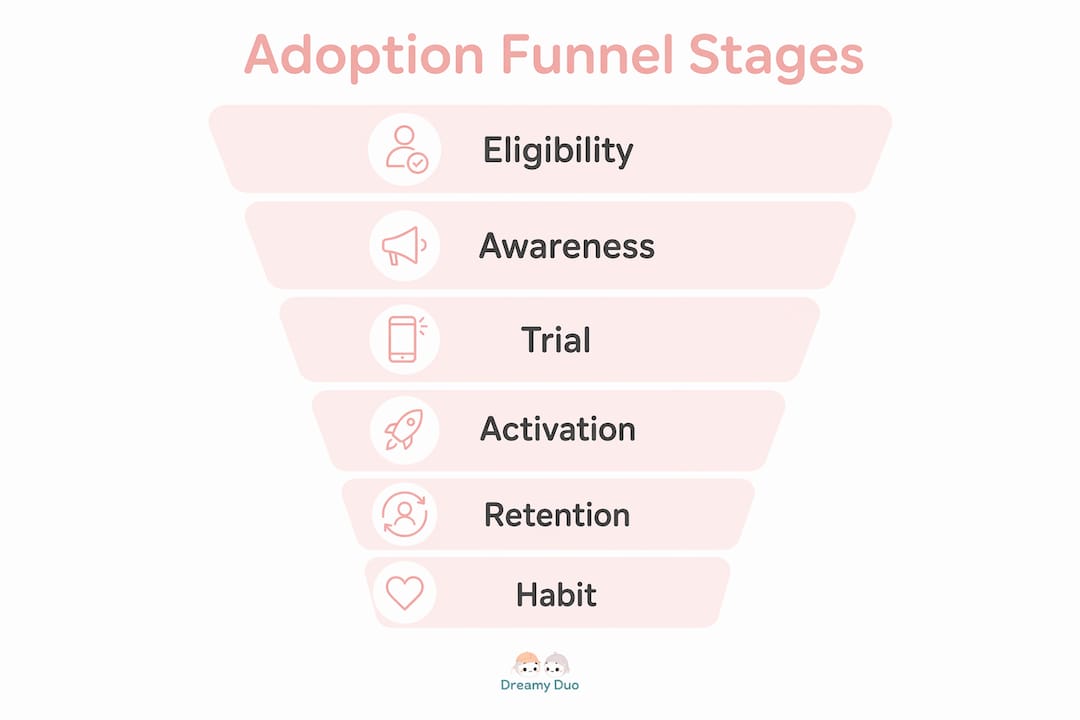
The standard adoption funnel covers six stages: eligibility, awareness, trial, activation, retention, and habit. Each stage has measurable indicators. Eligibility tells you who can adopt. Awareness tells you who knows about the feature. Trial, activation, retention, and habit tell you whether adoption is sticking.
The critical distinction is between activity metrics and outcome metrics. Activity metrics count completions. Outcome metrics measure whether users achieved the behaviour the feature was designed to produce. Most teams track activity and call it done.
The biggest gap in adoption programmes is the absence of outcome trackers. Successful teams track hidden metrics that connect feature usage to revenue impact. That connection is what turns adoption data into a business case.
Key metrics worth tracking include:
- Activation rate: the percentage of users who complete a meaningful first action
- Time-to-value: how quickly a user reaches their first success moment
- Retention rate: whether users return to the feature after the first use
- Habit score: frequency of use over a defined period
- Outcome completion: whether the user achieved the intended behavioural goal
Pro Tip: Focus your first tracker on the single behaviour that most directly predicts revenue or retention. Adding five trackers at once produces noise. One well-chosen outcome tracker produces signal.
How does tracking adoption catalysts improve ROI and decision-making?
The business case for monitoring adoption metrics is direct. Features with low adoption rates signal failure early, often within weeks. That early signal allows teams to pivot, iterate, or cut before the cost of failure scales. Features with high adoption rates justify further investment with data rather than advocacy.
User-requested features adopt 3–4 times faster than features built from internal assumptions. That ratio has a direct implication for roadmap planning. If you are not tracking which features users are requesting and then monitoring adoption after launch, you are building blind.
Treating a feature voting board as a launch list taps into high-intent adopters and yields 3–4 times higher adoption rates than general release campaigns. Notifying voters first creates social proof and closes the feedback loop between user input and product delivery.
The same logic applies in investment contexts. Tracking catalytic capital investments manages risk from first-time managers and ensures that both financial and societal returns are measurable. The principle is identical: without tracking, you cannot distinguish a catalyst from a coincidence.
Pro Tip: Use your feature voting board as a pre-qualification list. When you launch a new feature, notify voters first. Their adoption rate will be your fastest and most reliable signal of genuine product-market fit.
Understanding early trend adoption gives strategists a measurable edge. Teams that act on adoption signals within weeks outperform those that wait for quarterly reviews.
What advanced techniques are shaping adoption catalyst monitoring?
AI is the most significant shift in how teams track adoption catalysts. Automated systems now detect stalled accounts in real time and trigger targeted interventions before churn occurs. AI-driven triggers on activation rate and time-to-value allow customer success teams to act on signals rather than schedules.
The integration of adoption tracking with CRM systems, analytics platforms, and customer success tools creates a connected data layer. That layer means adoption signals no longer sit in a separate dashboard. They surface inside the workflows where decisions are made.
Advanced teams structure their tracking around four priorities:
- Activation milestones: defined moments where a user crosses from passive to active
- Time-to-value benchmarks: the speed at which users reach their first meaningful outcome
- Product stickiness scores: frequency and depth of engagement over time
- Multiple trackers per account: advanced teams average 20 trackers per account, compared to one tracker for foundational teams
That gap between 20 and 1 is not a technical difference. It reflects a fundamentally different relationship with measurement. Advanced teams treat tracking as a core capability. Foundational teams treat it as a reporting task.
The caution here is real. Tracking 20 metrics without a plan to act on each one produces decision fatigue. Every tracker needs an owner and a defined response protocol. AI-driven tracking transforms adoption programmes precisely because it automates the response, not just the detection.
For a broader view of how AI is reshaping tracking workflows, the AI trend examples from real-world deployments show where automation is delivering the clearest gains.
How to implement an effective adoption catalyst tracking system
Setting up a tracking system that delivers reliable insight requires a disciplined sequence. The most common mistake is building a comprehensive dashboard before validating that any single tracker produces useful data.
Incrementally adding trackers to your highest-traffic experiences first yields faster, reliable outcome data. This approach lets teams validate or disprove assumptions within weeks without extending roadmaps. Start with one experience, prove the tracker works, then expand.
A practical implementation sequence looks like this:
- Identify your highest-traffic user experience. This is where a tracker will generate enough data to be statistically meaningful quickly.
- Define the outcome, not the activity. Write down what behaviour change the feature is meant to produce before you build the tracker.
- Assign a single owner. Every tracker needs one person responsible for reviewing it and acting on what it shows.
- Set a review cadence. A weekly scorecard reviewing market intelligence, community momentum, and platform maturity signals prevents teams from overreacting to short-term noise.
- Define the response protocol. Before launching a tracker, decide what action you will take if adoption is below threshold at week four.
The adoption funnel drop-off framework is the most useful diagnostic tool at this stage. Map where users exit the funnel, whether at awareness, trial, or activation, and tailor the intervention to that specific stage. A drop-off at awareness requires a different fix than a drop-off at retention.
| Funnel stage | Drop-off signal | Recommended response |
|---|---|---|
| Awareness | Low feature discovery rate | In-product tooltips, onboarding prompts |
| Trial | High abandonment on first use | Simplify the first-use flow |
| Activation | Users complete steps but do not return | Improve the value moment clarity |
| Retention | Users return once then stop | Add habit-forming triggers or reminders |
| Habit | Inconsistent frequency | Personalise engagement based on use pattern |
Pro Tip: A focused weekly scorecard with three to five metrics outperforms a dashboard with thirty. Fewer metrics, reviewed consistently, produce better decisions than comprehensive data reviewed occasionally.
Understanding trend adoption rate as a baseline metric gives your tracking system a reference point against which all other signals can be calibrated.
Key takeaways
Tracking adoption catalysts is the discipline that separates teams who react to failure from those who predict and prevent it, using outcome-focused metrics, AI-driven detection, and a weekly review cadence.
| Point | Details |
|---|---|
| Outcome over activity | Track whether users achieved the intended behaviour, not just whether they completed a workflow. |
| Early signals save money | Features at 3% adoption signal failure within weeks; acting early prevents compounding resource waste. |
| Advanced teams track more | Teams averaging 20 trackers per account outperform those with one, but every tracker needs an owner. |
| AI automates intervention | AI-driven triggers on activation and time-to-value allow teams to act before churn, not after. |
| Weekly scorecards work | A focused review of three to five signals weekly delivers better decisions than monthly dashboard reviews. |
The measurement gap most teams refuse to close
The honest observation from watching teams build adoption programmes is that most of them are measuring the wrong thing and know it. They track completions because completions are easy to count. They avoid outcome tracking because it requires agreeing on what success actually looks like, and that conversation is uncomfortable.
The feedback loop between build, measure, and iterate is where most programmes break down. Teams build a feature, ship it, watch a completion rate climb, and declare success. Six months later, the feature is unused and nobody can explain why. The completion rate was real. The outcome was never tracked.
What I have seen work is a simple rule: before any feature ships, the team must write down the behaviour change it is designed to produce and agree on how that change will be measured. That single discipline closes the gap between activity tracking and outcome tracking faster than any tool or platform.
AI-driven tracking is making this easier. Automated behavioural monitoring removes the manual burden of watching dashboards. But the technology only works if the outcome definition exists before the tracker is built. The tool cannot define success for you.
The teams that treat adoption tracking as a core strategic capability, not a reporting function, are the ones that consistently make better product and investment decisions. The data is available. The question is whether your organisation has the discipline to act on it.
— Aidil
Ontherice and the signals that matter for adoption tracking
Business strategists who need to track adoption catalysts at scale require more than internal dashboards. They need market-level signals that reveal which trends are gaining genuine momentum before they reach mainstream awareness.

Ontherice uses multiple AI engines to scan global data points and produce real-time rankings across diverse markets. The AI opportunities platform identifies emerging adoption signals and scores them for momentum, giving strategists a structured view of where catalysts are building. For teams that need to monitor adoption trends across sectors, the general signals feed provides a continuously updated layer of market intelligence. Ontherice is built for professionals who need to act on adoption data before their competitors do.
FAQ
What are adoption catalysts in business strategy?
Adoption catalysts are the measurable factors that accelerate the uptake of a product, feature, or technology. They include regulatory changes, community advocacy, pricing shifts, and early-adopter behaviour.
Why does tracking adoption catalysts matter for ROI?
Features with low adoption rates signal failure early, allowing teams to cut losses within weeks rather than quarters. Features adopted at 45% justify continued investment with data rather than internal advocacy.
What is the difference between activity tracking and outcome tracking?
Activity tracking counts whether a user completed a workflow. Outcome tracking measures whether the user achieved the behaviour the feature was designed to produce. Outcome tracking is the stronger predictor of revenue impact.
How many adoption trackers should a team use?
Advanced teams average 20 trackers per account, but each tracker requires an owner and a defined response protocol. Starting with one well-chosen outcome tracker and expanding incrementally produces more reliable data than launching many at once.
How does AI improve adoption catalyst monitoring?
AI detects stalled accounts in real time and triggers targeted interventions before churn occurs. Automated monitoring of activation rate and time-to-value removes the manual burden of dashboard review and allows teams to act on signals rather than schedules.