

TL;DR:
- Trend adoption rate measures how quickly new users embrace a trend relative to the total market. It guides businesses in resource allocation and campaign timing to ensure sustainable growth.
Trend adoption rate is defined as the percentage of new users who embrace a trend, innovation, or feature within a specific period, measured against the total addressable market. Known formally within diffusion theory as the adoption rate, this metric quantifies how quickly a new behaviour, product, or idea moves from early enthusiasts into mainstream use. For business professionals, analysts, and marketers, it is one of the clearest signals of whether a trend has real commercial momentum or is simply generating noise. Understanding what is trend adoption rate gives you the foundation to allocate resources with confidence, time campaigns accurately, and avoid the costly mistake of scaling spend on a fad.
What is trend adoption rate and how is it calculated?
Trend adoption rate is calculated using a straightforward formula: divide the number of new users who adopted the trend during a given timeframe by the total addressable market, then multiply by 100. For example, 4,000 new customers from 80,000 total leads produces a 5% adoption rate for that quarter. That single percentage tells you both the speed and the penetration of a trend at a given moment.

The formula applies equally to product features, marketing campaigns, and broader market trends. A business tracking a new checkout feature, for instance, would count the number of users who activated it against the total user base. The resulting rate reveals whether the feature is gaining traction or sitting dormant.
Adoption rate differs from engagement rate. Adoption measures whether someone started using something. Engagement measures how deeply and frequently they use it once they have. Both matter, but adoption rate is the entry point for any trend analysis.
Pro Tip: Track adoption rate at consistent intervals, such as 30 days and 90 days, to distinguish a genuine trend from a short-lived spike.
Benchmarks that define healthy adoption
Feature adoption benchmarks vary by feature type. Core features should reach 60–90% adoption within 30 days. Enhancements typically land between 20–40%. Niche features perform acceptably at 10–25%. Any feature sitting below 10% at the 30-day mark signals a problem that needs investigation.
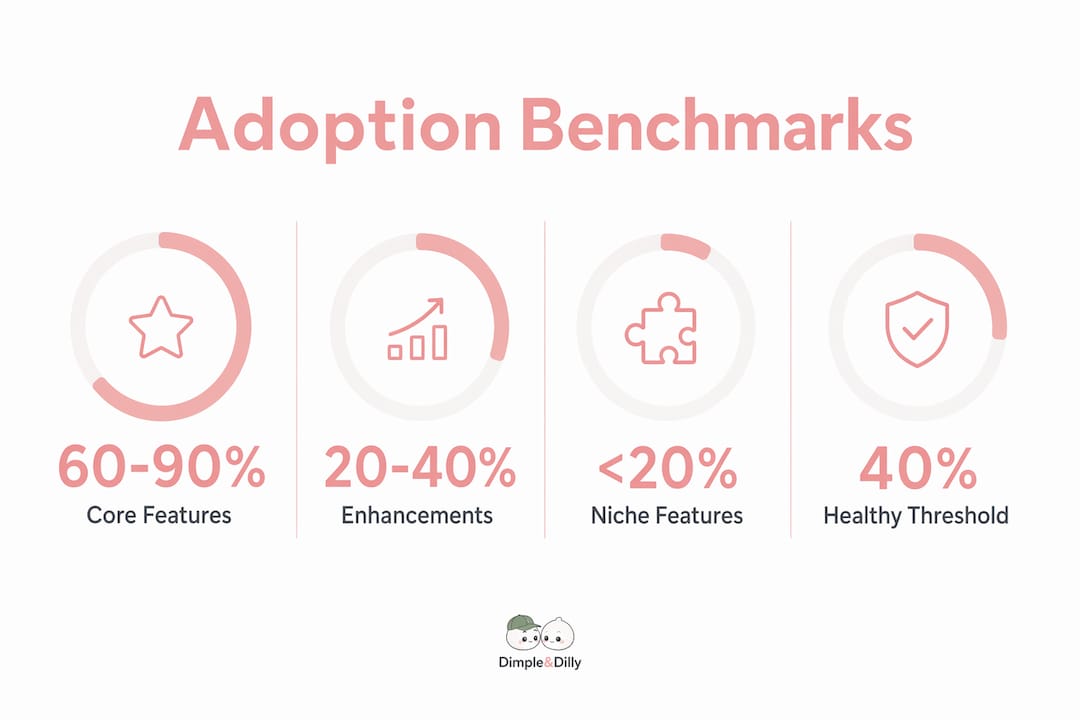
These benchmarks give analysts a reference point. A 40% adoption rate at 30 days for an enhancement feature is a healthy result. A 5% rate for a core feature at the same interval demands immediate attention.
| Feature type | Healthy adoption at 30 days | Intervention threshold |
|---|---|---|
| Core features | 60–90% | Below 10% |
| Enhancements | 20–40% | Below 10% |
| Niche features | 10–25% | Below 10% |
What are the categories of adopters and why do they matter?
Everett Rogers' diffusion of innovations model divides the population into five adopter categories: innovators, early adopters, early majority, late majority, and laggards. Each group enters the adoption curve at a different point, and each requires a different marketing approach. Understanding where your current adopters sit tells you exactly how far along the adoption lifecycle a trend has travelled.
Innovators represent the first wave. They seek novelty and tolerate risk. Early adopters follow and carry significant influence because their peers trust their judgement. The early majority and late majority represent the bulk of the market, and laggards adopt only when a trend has become unavoidable.
- Innovators: Risk-tolerant, first to adopt, small in number but high in influence on early signals.
- Early adopters: Opinion leaders who validate a trend for the broader market.
- Early majority: Pragmatic adopters who follow proven success rather than novelty.
- Late majority: Sceptical adopters who move only when a trend is well established.
- Laggards: Adopt last, often only when alternatives disappear.
Adoption rates reflect the gradual inclusion of these groups over time. When plotted, the cumulative adoption curve forms an S-shape. The curve rises slowly during the innovator and early adopter phases, accelerates through the early and late majority, and flattens as laggards join. Recognising which part of the S-curve a trend occupies is critical for timing broader marketing efforts and avoiding premature or late investment.
Viral trends reach early adopter thresholds within 48–72 hours of emergence. Brands that monitor cross-platform amplification patterns at this stage gain a measurable advantage over those waiting for mainstream confirmation.
What factors affect trend adoption rates?
Several forces shape how quickly a trend moves through a market. Relevance is the most direct. A trend that aligns with existing consumer behaviour and brand values spreads faster than one that requires significant behavioural change. Trend adoption success depends on alignment to brand voice, tangible business value, and long-term strategic fit rather than short-term hype.
Timing is the second major factor. The "Speed with Sense" framework captures this well: move early, but move deliberately. Brands that act during the early adopter phase gain first-mover credibility. Those that wait for mainstream confirmation often find the window has closed or the cost of entry has risen sharply.
- Relevance to audience: Trends that match existing consumer values spread faster and retain users longer.
- Brand alignment: Trends adopted without strategic fit produce short adoption spikes and poor retention.
- Marketing timing: Acting during the early adopter phase maximises reach and cost efficiency.
- Ease of adoption: Lower friction in the user experience directly increases adoption speed.
- Social proof: Visible adoption by peers and trusted voices accelerates uptake across all adopter categories.
Trends that form true behavioural changes move through four phases: emerge, peak, decline, and integration. Scaling marketing spend during the peak phase without confirming retention leads to wasted budget. The most common mistake analysts see is treating peak-phase traffic as evidence of long-term adoption.
Pro Tip: Before scaling spend on a trend, confirm that 90-day retention data supports the 30-day adoption figures. A spike without retention is a fad, not a trend.
A further factor that analysts increasingly monitor is the source of adoption signals. Misreading adoption signals by failing to distinguish human adoption from AI-driven sessions can distort perception of success and inflate apparent adoption rates. This is particularly relevant for digital products where automated interactions can mimic genuine user behaviour.
How do businesses apply adoption metrics to strategic decisions?
Adoption metrics become genuinely useful when they inform decisions rather than simply report outcomes. The first application is identifying bottlenecks. A 12% adoption rate after 30 days for a new feature signals friction in the user experience, a gap in onboarding, or a mismatch between the feature and user needs. Each of these has a different fix.
The second application is distinguishing short-term interest from sustained integration. Tracking adoption across 30 and 90 days reveals whether users are genuinely incorporating a trend into their workflows or simply experimenting. Thirty-day data reflects organic discovery. Ninety-day data reveals retention and true integration.
- Identify friction points: Low adoption at 30 days points to onboarding gaps or poor feature visibility.
- Assess retention: Compare 30-day and 90-day adoption rates to separate genuine integration from curiosity.
- Prioritise development: Features with high adoption depth warrant further investment; low-adoption features need redesign or removal.
- Adjust campaign timing: Adoption data tells you when a trend is entering the early majority phase, the optimal moment to scale paid campaigns.
- Allocate resources: Adoption rate trends across product lines help leadership direct budget toward the highest-momentum areas.
Following relevant trends increases business adaptability, allowing companies to pre-empt market shifts and maintain relevance by aligning with changing consumer behaviour. Trends serve as early signals for evolving consumer values. Businesses that treat adoption metrics as a continuous intelligence feed rather than a one-off report consistently outperform those that measure adoption only at launch.
Proactive trend scouting compounds this advantage. Analysts who track emerging trend signals before mainstream adoption peaks can build campaigns and product features that are ready when the early majority arrives, rather than scrambling to catch up.
Key takeaways
Trend adoption rate is the single most reliable metric for distinguishing genuine market momentum from short-lived noise, and measuring it across 30-day and 90-day intervals gives analysts the clearest picture of whether a trend will sustain.
| Point | Details |
|---|---|
| Core definition | Adoption rate equals new adopters divided by total addressable market, multiplied by 100. |
| Benchmarks matter | Core features should reach 60–90% adoption within 30 days; below 10% signals a problem. |
| Adopter categories | Rogers' five categories map directly to S-curve phases and guide campaign timing decisions. |
| Factors affecting adoption | Relevance, brand alignment, timing, and ease of adoption each directly influence adoption speed. |
| Strategic application | Compare 30-day and 90-day data to separate genuine integration from short-term curiosity. |
Why I think most businesses measure adoption too late
Most analysts I have spoken with treat adoption rate as a post-launch metric. They measure it after a campaign has run, after a feature has shipped, or after a trend has already peaked. That approach turns a forward-looking signal into a retrospective report.
The real value of adoption rate lies in measuring it early and often. A 5% adoption rate at day seven tells you something fundamentally different from a 5% rate at day thirty. The first is a starting point. The second is a warning sign. Most businesses never make that distinction because they only pull the data once.
The second mistake I see consistently is treating adoption breadth as the only measure that counts. A trend adopted by many users at a shallow level is far less valuable than one adopted by fewer users who integrate it deeply into their workflows. Depth of adoption predicts retention. Breadth of adoption predicts reach. You need both numbers to make a sound decision.
The businesses that use adoption metrics well are the ones that treat them as a continuous signal rather than a project deliverable. They check adoption weekly, adjust messaging based on what the data shows, and scale only when both 30-day and 90-day figures confirm sustained integration. That discipline separates companies that ride trends profitably from those that chase them expensively.
— Aidil
Trend intelligence built for adoption tracking
Knowing the formula for adoption rate is one thing. Having the data infrastructure to track it across markets, in real time, before a trend reaches mainstream awareness, is another entirely.

Ontherice uses multiple AI engines to scan global data points, extract meaningful signals, and rank emerging trends across sectors. The SignalsInternational service gives analysts access to cross-market trend data suited to tracking adoption momentum before it peaks. For broader market intelligence, the GeneralSignals tool surfaces rising patterns across industries, giving marketing and strategy teams the early signals they need to act during the early adopter phase rather than the late majority. Ontherice is built for professionals who want to measure adoption with precision and act on it with confidence.
FAQ
What is the standard formula for trend adoption rate?
Trend adoption rate equals the number of new adopters in a given period divided by the total addressable market, multiplied by 100. For example, 4,000 new customers from an 80,000-person market equals a 5% adoption rate.
What is a good adoption rate for a new product feature?
Core features should reach 60–90% adoption within 30 days. Enhancements typically land at 20–40%, and niche features at 10–25%. Any feature below 10% at 30 days requires investigation.
How does the Rogers diffusion model relate to adoption rate?
Rogers' model identifies five adopter categories: innovators, early adopters, early majority, late majority, and laggards. Adoption rate rises as each successive group enters the market, producing the characteristic S-curve pattern.
Why does adoption rate drop between 30 and 90 days?
A drop between 30-day and 90-day adoption figures indicates that early users experimented but did not integrate the trend into their regular behaviour. This pattern signals a retention problem rather than an adoption success.
What is the difference between a trend and a fad in adoption terms?
A trend shows sustained or growing adoption across the 30-day to 90-day window and moves through the Rogers adopter categories progressively. A fad produces a sharp adoption spike followed by rapid decline before reaching the early majority phase.