
What sector dynamism actually means
Sector dynamism describes the rate and nature of change within economic sectors, measured through the reallocation of labour and capital and the shifting contributions those sectors make to GDP and employment. It is not simply about whether an economy is growing. It captures how the structure of that economy is changing beneath the surface.
The concept sits within the broader field of business dynamism, but it operates at a different level of analysis. Business dynamism typically tracks firm-level activity, such as start-up rates, job creation, and firm exits. Sector dynamism zooms out to examine how entire industries gain or lose economic weight over time. The Office for National Statistics (ONS) treats this distinction as central to understanding UK productivity trends, publishing dedicated analysis on how sector-level shifts relate to aggregate output.
A few core aspects define the concept:
- Resource reallocation: labour and capital move between sectors in response to demand shifts, technological change, and policy signals
- Contribution to GDP and employment: sectors expand or contract their share of national output and workforce over time
- Productivity implications: when resources move towards higher-productivity sectors, aggregate output per worker tends to rise
- Cyclical sensitivity: the pace of sectoral change accelerates during recessions and slows during stable expansions
Understanding sector dynamism matters because it explains why two economies with identical headline growth rates can have very different long-run productivity trajectories. The UK's persistent productivity puzzle, for instance, cannot be resolved by looking at GDP alone.
How sectoral reallocation drives economic performance
Sectoral reallocation is the core mechanism behind sector dynamism. It refers to the movement of workers and investment across industries over time, and its effects on productivity, innovation, and growth are well documented.

When resources shift towards sectors with higher output per worker, aggregate productivity rises even without any individual firm becoming more efficient. This is sometimes called the "between-sector" component of productivity growth, and it is distinct from improvements happening within individual firms. Both matter, but the between-sector channel is particularly sensitive to policy and structural conditions.
The cyclical behaviour of sectoral reallocation is striking. Sectoral shifts are about 1.5 times larger during recessions than during expansions, based on data covering 1948 to 2010. That asymmetry is not a coincidence. Recessions force rapid adjustments that normal growth periods do not, compressing into months what might otherwise take years.
Key economic roles and outcomes of sectoral dynamics include:
- Productivity growth: reallocation from low to high-productivity sectors raises output per worker at the aggregate level
- Labour market adjustment: workers displaced from contracting sectors face transition costs, including periods of unemployment and potential wage losses
- Innovation diffusion: dynamic sectors attract investment and talent, accelerating the spread of new technologies across the economy
- Aggregate volatility: sectoral dynamics contribute to GDP growth volatility, with their share of annual variation increasing over recent decades
- Macroeconomic propagation: sector-specific shocks travel through input-output networks, affecting industries far removed from the original disruption
Statistic callout: Research covering the US economy from 1948 to 2010 found that sectoral shifts were significantly larger in recessions than in expansions, and that the larger those shifts, the more severe the recession tended to be.
The policy relevance here is direct. Governments that understand which sectors are absorbing or releasing resources can design more targeted labour market support, training programmes, and investment incentives. Without that sectoral lens, macro policy risks being blunt where precision is needed.
UK business dynamism and productivity: what the data shows
The UK's record on business dynamism and productivity is one of the more closely watched in the developed world, partly because the gap between the UK and comparable economies has proved so persistent. ONS data on trends in business dynamism and productivity reveals a picture of structural change happening unevenly across sectors.
Firm entry and exit rates, the share of employment at young firms, and the pace of job reallocation all serve as proxies for sector dynamism at the firm level. Across the UK economy, these indicators have shown a broadly declining trend over the past two decades, mirroring patterns observed in the United States and other OECD economies. The OECD's analysis of declining business dynamism finds that the fall stems primarily from changes within sectors rather than from shifts between them, which has significant implications for how policymakers should respond.
The following table illustrates how labour productivity and dynamism indicators vary across major UK sectors, drawing on ONS and OECD findings:
| Sector | Relative labour productivity | Dynamism trend |
|---|---|---|
| Information and communication | High | Rising |
| Financial and insurance services | High | Stable to declining |
| Manufacturing | Moderate | Declining |
| Construction | Below average | Declining |
| Accommodation and food services | Low | Volatile |
| Professional and scientific services | Moderate to high | Mixed |
Statistic callout: The share of employment at young firms in the US fell from around 20% to 10% over recent decades, a trend broadly replicated in UK data, signalling a structural weakening of business dynamism across advanced economies.
The digital transformation of the economy adds a further layer of complexity. The rise of intangible assets, including software, data, and intellectual property, has altered market structures in ways that increase barriers to entry and slow knowledge diffusion to smaller firms. This partly explains why productivity dispersion between leading and lagging firms has widened, particularly in the information sector. Understanding industry momentum trends at the sector level is increasingly necessary for anyone trying to make sense of where UK growth is actually coming from.
How the COVID-19 pandemic reshaped sector dynamics
The pandemic was not a uniform shock. It hit sectors with radically different force, and the sectoral dynamics it triggered were unlike anything seen in a typical recession.
The European Central Bank's Economic Bulletin identifies sector dynamism as both a source and a propagation mechanism of macroeconomic fluctuations, and the pandemic illustrated this with unusual clarity. The semiconductor shortage that crippled automotive production, and the transport sector's inability to source sufficient labour, were sector-specific shocks that cascaded through input-output networks into the wider economy.
Key pandemic-related sectoral dynamics in the UK included:
- Hospitality and retail experienced severe contractions, with firm exits accelerating and labour reallocation towards logistics and healthcare
- Information and communication expanded rapidly, absorbing workers and investment as remote working and digital services surged
- Construction faced supply chain disruptions that compressed output even as demand for housing remained strong
- Financial services proved relatively resilient, with remote-capable workforces and stable demand for core services
- Manufacturing suffered from both demand shocks and input shortages, particularly in sectors reliant on global supply chains
The distinction between within-sector and cross-sector reallocation became especially visible during this period. Cross-sectoral shifts within countries are associated with recessions, while reallocation between countries tends to underpin prolonged recoveries. The pandemic accelerated both processes simultaneously, creating an unusually complex adjustment path for the UK economy.
Policy lessons from this period point towards the importance of flexible labour markets, portable skills frameworks, and sector-specific support mechanisms that can be activated quickly. The furlough scheme, for instance, preserved employment relationships within sectors but may have slowed the cross-sector reallocation that longer-run productivity recovery requires. Monitoring cross-sector trend shifts in real time became a practical necessity for both government and business during this period, not an academic exercise.
How researchers measure sector dynamism
Quantifying sector dynamism requires moving beyond qualitative descriptions of which industries are "growing" or "shrinking." Rigorous measurement uses index-based approaches that capture the pace and distribution of structural change across the whole economy.
The Sectoral Dynamics Index
The most widely used approach constructs a Sectoral Dynamics Index (SDI) by calculating the average absolute change in each sector's share of total output or employment between consecutive periods. The formula is straightforward: sum the absolute values of changes in sectoral shares across all sectors, then divide by the number of sectors. A higher index value means more pronounced structural change. The index can be built using value-added data, employment data, or both, and it scales across different levels of sectoral disaggregation.
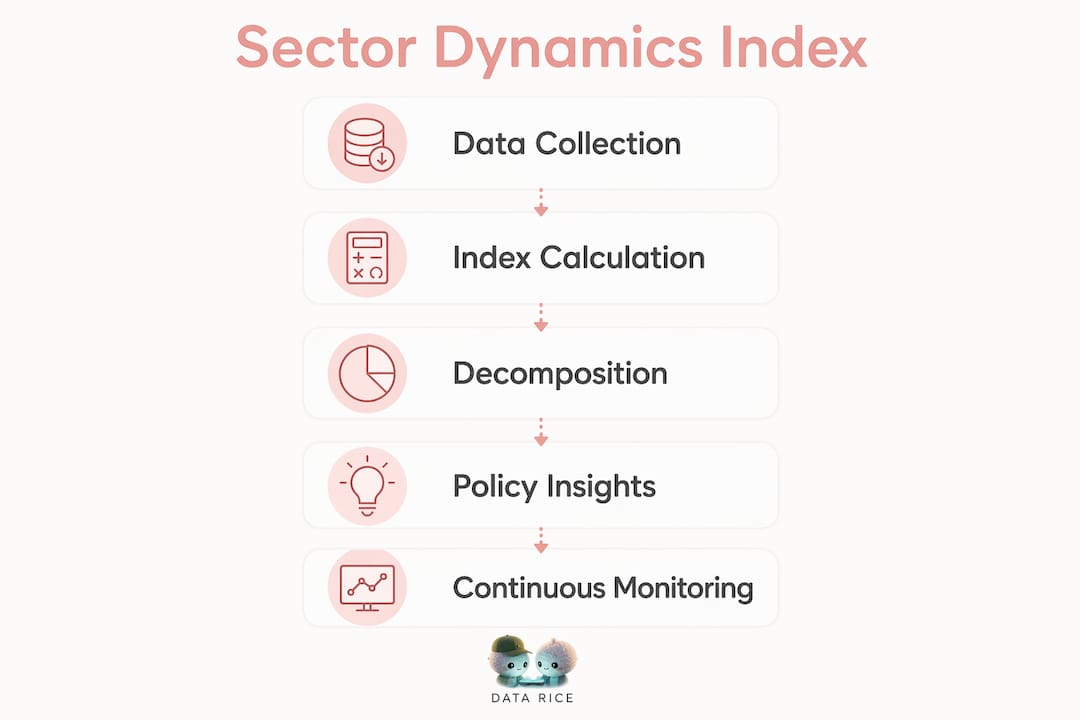
The ECB's methodology extends this by decomposing the overall index into two components: shifts occurring between countries (reflecting cross-border relocation of production) and shifts occurring within countries (reflecting domestic reallocation across sectors). These two components behave very differently over the business cycle, which is why the decomposition matters for policy.
The quadrant classification framework
The Piraeus Bank Sectoral Dynamics Index report classifies sectors into four quadrants based on two dimensions: whether a sector's output level is high or low relative to peers, and whether its trajectory is accelerating or decelerating. This produces four categories:
- High and accelerating: sectors gaining share and growing faster, the clearest candidates for investment and policy support
- High and decelerating: strong sectors losing momentum, warranting attention to structural headwinds
- Low and accelerating: emerging sectors with growth potential but limited current scale
- Low and decelerating: contracting sectors where reallocation away from them may be appropriate
This quadrant approach gives policymakers and business analysts a practical tool for prioritising where interventions are most likely to generate returns. It also makes the abstract concept of sector dynamism concrete enough to act on.
Statistic callout: Research using the SDI methodology found that sectoral dynamics contributed an increasingly dominant share of GDP growth volatility over recent decades, rising notably by 2010, suggesting that structural change has become an increasingly dominant driver of aggregate economic fluctuations.
Key metrics used in sector dynamism measurement include:
- Sectoral share changes: shifts in each sector's proportion of total GDP or employment over time
- Job reallocation rates: gross flows of jobs created and destroyed within and across sectors
- Productivity dispersion: the spread between the most and least productive firms within a sector
- Firm entry and exit rates: the pace at which new firms enter and failing firms leave a sector
- Input-output linkage intensity: how tightly a sector is connected to others, affecting shock propagation
Pro Tip: When using the SDI for policy analysis, always decompose the index into its within-country and between-country components. A high overall index driven by between-country shifts signals a recovery dynamic; the same index value driven by within-country shifts typically precedes a contraction.
Platforms like Ontherice apply AI-driven signal detection to this kind of structural data, scanning sector-level trends in real time to surface momentum shifts before they appear in official statistics. For researchers and analysts who cannot wait for quarterly ONS releases, that kind of applied intelligence fills a genuine gap. Technology partners working at the intersection of sector data and development are also building tools that make SDI-style analysis more accessible outside academic settings.
Key takeaways
Sector dynamism is the most granular and policy-relevant lens through which to understand structural economic change, and the UK's productivity challenge cannot be addressed without it.
| Point | Details |
|---|---|
| Core definition | Sector dynamism measures how sectors shift in their share of output and employment over time through resource reallocation. |
| Cyclical asymmetry | Sectoral shifts are about 1.5 times larger during recessions than expansions, and larger shifts correlate with more severe downturns. |
| UK productivity link | Declining business dynamism in the UK stems mainly from within-sector changes, not cross-sector reallocation, per OECD analysis. |
| Pandemic lesson | COVID-19 showed that within-country cross-sectoral shifts precede recessions, while between-country shifts support prolonged recoveries. |
| Measurement tool | The Sectoral Dynamics Index and quadrant classification framework give analysts a structured way to monitor and act on sector health. |