TL;DR:
- Effective cross-sector trend mapping requires a structured, five-phase lifecycle to identify, cluster, and translate signals into actionable decisions. Proper scope definition, signal classification, and prioritization—using frameworks like STEEP and impact versus timing matrices—are essential to avoid noise and strategic drift. Combining human judgment with AI automation enhances early signal detection and supports nuanced analysis for better foresight outcomes.
Most business strategists understand that the next disruption rarely comes from within their own industry. Yet without a proper cross-sector trend mapping guide, the process of monitoring signals across healthcare, technology, regulation, finance, and consumer behaviour simultaneously becomes an exercise in managed chaos. The volume of data is not the problem. The absence of a repeatable, structured method is. This guide walks you through a five-phase lifecycle for identifying, clustering, and translating trend signals into decisions your organisation can actually act on, with specific techniques for avoiding the traps that derail most foresight programmes.
Table of Contents
- Key takeaways
- Setting scope for cross-sector trend mapping
- Scanning and collecting cross-sector signals
- Analysing and mapping trend trajectories
- Translating trend insights into business decisions
- Common pitfalls in cross-sector mapping
- My take on what separates good foresight from great foresight
- Discover AI-powered trend intelligence with Ontherice
- FAQ
Key takeaways
| Point | Details |
|---|---|
| Scope before you scan | Define strategic questions and sector boundaries before collecting a single data point to avoid noise overload. |
| Classify every signal | Tag trends as macro, micro, seasonal, or cyclical from the start to calibrate the right strategic response. |
| Cluster, then prioritise | Group signals into themes and use an impact vs timing matrix to rank which trends warrant immediate action. |
| Build institutional memory | Annotate dashboards with trend type and maturity so your team learns from every mapping cycle. |
| Translate, never transplant | Adapt the principles behind cross-sector successes rather than copying practices directly into your context. |
Setting scope for cross-sector trend mapping
The trend mapping process follows a five-step lifecycle from scoping to translating insights into business decisions, and scoping is the step most teams rush past. That is where the damage begins. Before you open a single data feed, you need a crisp answer to three questions: What decisions are we trying to inform? Which sectors are adjacent enough to matter? And over what time horizon are we looking?
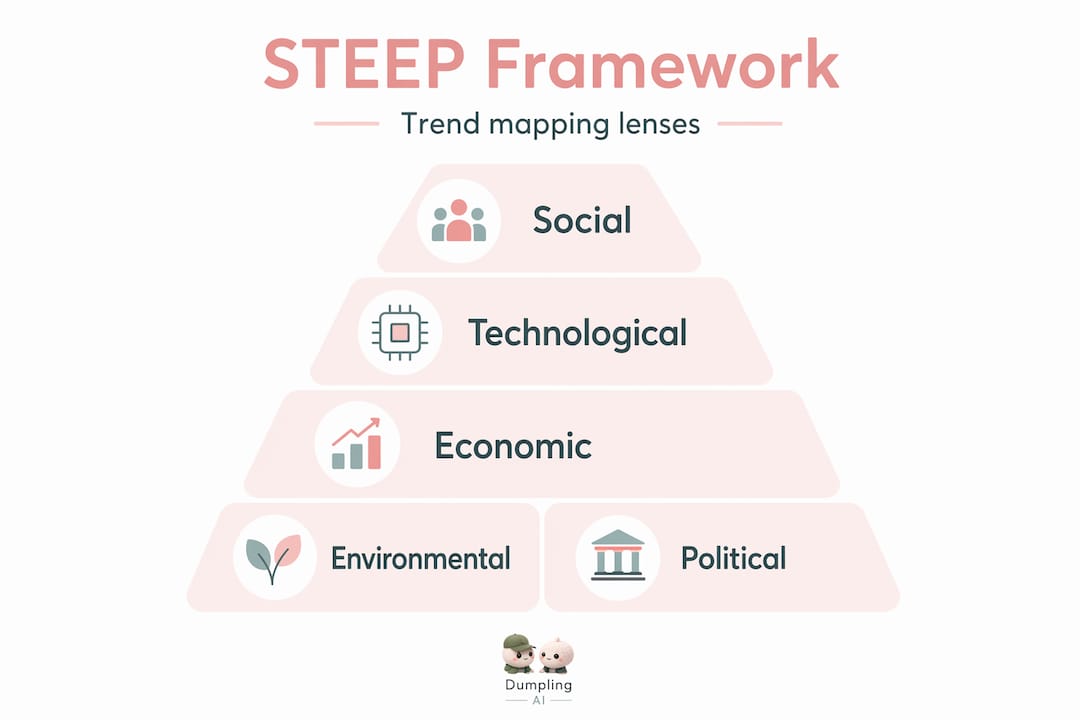
The STEEP framework (Social, Technological, Economic, Environmental, Political) gives you a structured set of lenses to apply across sectors without letting scope creep take over. Work through each category and ask which one, if it shifted dramatically, would most directly affect your strategic position. That exercise alone will cut your scanning universe in half.
Once you have your categories, classify the trends you expect to find before you start looking. Trends fall into four types: macrotrends (decade-long structural shifts), microtrends (two to five year movements), seasonal patterns, and cyclical movements. Each demands a different response budget and timeline. Macrotrends drive capability-building decisions. Microtrends call for nimble experiments. Getting these confused early will cost you months of misdirected effort later.
Key resources to put in place before scanning begins:
- A shared taxonomy document for trend types and STEEP categories
- Access to at least three data sources per sector you plan to monitor (academic publications, trade press, and regulatory filings work well as a baseline set)
- A designated tagging lead who owns signal classification from week one
- A horizon calendar that defines short, medium, and long-term review windows
Pro Tip: Resist the temptation to scan every sector equally. Pick three to five adjacent sectors where your strategic questions intersect and go deep on those before expanding outward.
Scanning and collecting cross-sector signals
With scope defined, execution begins. Systematic signal collection is where most interdisciplinary trend exploration efforts diverge in quality. The analysts who produce consistently strong output do not simply read more. They read differently, and they read across the right zones.
Five zones tend to yield the highest concentration of early signals:
- Regulatory filings and consultation papers. Governments signal future constraints and enablers months or years before enforcement. Monitoring these across adjacent markets gives you early warning on compliance costs and new market structures.
- Academic pre-prints and patent filings. Science moves faster than business adoption, which means a patent cluster in an adjacent field today often becomes a product category in three to five years.
- Startup funding rounds and accelerator cohorts. Follow the money. When multiple venture funds back the same category across different geographies simultaneously, that is rarely coincidence.
- Fringe communities and practitioner forums. Reddit threads, niche Slack groups, and specialist Discord servers often surface behavioural shifts before they register in any survey.
- Technology stack adoption data. Tracking which infrastructure tools startups are adopting tells you which capabilities are becoming table stakes before the mainstream knows it.
Tag every signal you collect with its STEEP category, trend type, sector of origin, and confidence level. This tagging habit is not administrative overhead. It builds the institutional memory that prevents your team from rediscovering the same signals every quarter and calling it fresh insight.
AI-driven monitoring now automates data acquisition across these zones, reducing manual workload and enabling real-time alerts on anomalies. Platforms that track patent filings, scientific publications, and investment flows simultaneously can detect emergent trends far faster than any quarterly scan. For more on how this works in practice, see Ontherice's guide on AI trend monitoring.

Pro Tip: Vary your source types deliberately. If your scanning diet is 80% industry press and 20% everything else, you are reading lagging indicators, not leading ones. Aim for at least 40% of sources to sit outside your primary sector.
Analysing and mapping trend trajectories
Raw signals are not strategy. The analysis phase is where cross-industry trend insights either become decision-relevant intelligence or disappear into a shared drive nobody looks at.
Start by clustering your tagged signals into themes. A theme is a group of signals that, taken together, point to the same underlying shift. Individually, each signal might be explicable in isolation. Together, they form a pattern that is harder to dismiss. Use collaborative workshops or AI-assisted clustering tools to group signals before applying any matrix framework.
The 2x2 impact vs timing matrix is your primary prioritisation tool at this stage. Plot each theme on two axes: potential impact on your sector (low to high) and time to mainstream adoption (near to far). The quadrant you care most about is high impact combined with medium-term timing. Those are the trends you have a window to act on.
| Trend type | Time horizon | Recommended strategic response |
|---|---|---|
| Macrotrend | 7+ years | Capability-building, R&D investment, long-range planning |
| Microtrend | 2 to 5 years | Pilot programmes, nimble experiments, partnership exploration |
| Seasonal pattern | Under 12 months | Operational adjustments, inventory and resourcing cycles |
| Cyclical movement | Varies | Risk hedging, scenario planning, financial buffer review |
Once themes are prioritised, move to stakeholder impact mapping. Plot stakeholder groups on influence vs impact axes to identify who has the power to accelerate or stall adoption of a given trend. This step surfaces the resistance points and the potential amplification partners your change strategy will need to account for. Leading firms now combine this manual analysis with AI tools that automate data cleaning, freeing strategy teams to focus on interpretation rather than compilation.
Annotate your dashboards. Record trend classification, maturity stage, source confidence, and any inflection point triggers. This living document becomes your team's analytical baseline for every future mapping cycle.
Translating trend insights into business decisions
Analysis without action is expensive curiosity. The verification phase is where cross-field analysis strategies either deliver return or evaporate into reports.
Begin by identifying your highest uncertainty variables. These are the trend dimensions where the evidence is credible but the direction is genuinely unclear. Build scenario frameworks around these variables rather than around the trends themselves. A scenario built around "what if synthetic biology becomes cost-competitive by 2029?" is more generative than one built around a trend label.
From your scenarios, define two categories of decisions. First, no-regret moves: actions that create value regardless of which scenario unfolds (building data infrastructure, training analyst teams, strengthening supplier relationships). Second, trigger-point actions: decisions you will take only when a specific condition is met (a regulatory announcement, a competitor funding round, a technology cost threshold). This approach gives your organisation the agility to move without the paralysis of waiting for certainty.
| Approach | Best used when | Key risk to manage |
|---|---|---|
| Scenario planning | Uncertainty is high and time horizon is long | Over-investing in unlikely extremes |
| No-regret moves | You need momentum regardless of outcome | Spreading resource too thin |
| Trigger-point actions | Decision requires a specific market condition | Missing the trigger window |
| Iterative pilots | Trend is real but sector translation is unclear | Piloting indefinitely without scaling |
Iterative trend mapping improves with each cycle. Revisit your trend tags quarterly. Promote signals that have gained confirmation evidence. Retire those that have stalled. The teams that build genuine foresight capability treat this review as a fixed organisational rhythm, not an annual exercise.
Pro Tip: Avoid transplantation. When a practice works brilliantly in one sector, the temptation is to copy it directly. Adapting underlying principles to your specific context almost always outperforms direct replication.
Common pitfalls in cross-sector mapping
Even well-resourced teams with strong methodologies make the same mistakes repeatedly. Knowing where the process breaks down is as useful as knowing the steps themselves.
- Signal-to-noise collapse. Scanning too broadly without a filtering discipline means your trend radar fills with plausible but irrelevant data. The fix is a pre-agreed signal relevance threshold before collection begins, not after.
- Strategic drift from over-scanning. Teams that monitor 40 sectors "just in case" rarely act decisively on any of them. Breadth without depth produces motion, not insight.
- Organisational resistance. Cross-sector insights frequently threaten existing business units. Without explicit executive sponsorship and a clear link between trend findings and budget decisions, foresight work gets deprioritised.
- Loss of institutional memory. When the analyst who built the trend taxonomy leaves, the organisation often starts from scratch. Tagging trends by type and maturity within a shared system prevents this from happening.
- Human-AI imbalance. AI tools excel at pattern detection across large datasets, but they need human judgement to assess strategic relevance and contextual nuance. Neither replaces the other.
Cross-sector collaboration also requires trust and transparency as foundational operating conditions. Without them, the stakeholder alignment that good trend mapping demands will not materialise, regardless of how strong your methodology is.
My take on what separates good foresight from great foresight
I've worked through enough trend mapping cycles to know that the methodology is the easy part to teach. The harder part is the discipline to use it honestly.
In my experience, the single most common failure is transplantation. A team sees something working spectacularly in fintech or logistics and grafts it onto their context without asking why it worked there. The underlying principles behind that success are almost always transferable. The practice itself rarely is. The distinction sounds simple. In practice, under time pressure and with stakeholders asking for quick wins, it gets collapsed constantly.
What I've found genuinely separates strong foresight teams is their relationship with uncertainty. The teams that produce the most useful output are the ones who have stopped trying to be right about what will happen and started focusing on what conditions would need to exist for a given trend to matter. That reframe changes everything about how you structure scanning, analysis, and decision-making.
I've also come to believe that AI has changed the role of the strategist more than most people in the profession have acknowledged. The shift from data gathering to strategic translation is not incremental. It is a genuine redefinition of where human judgement adds value. If your team is still spending 60% of its time collecting and cleaning data, you are not using the available tools well. Invest that time in interpretation and your output quality will compound over time.
— Aidil
Discover AI-powered trend intelligence with Ontherice
Applying every framework in this guide manually is possible, but it is slow and resource-intensive. Ontherice is built to remove that bottleneck. Its AI engines scan global data points continuously, extracting signals across sectors and generating ranked intelligence before trends reach mainstream awareness.
The AIOpportunities tool surfaces early market opportunities scored by momentum and relevance, while the RankingsGeneratorEngine lets you prioritise your strategic bets based on live trend data. For B2B-focused teams, B2BSignals delivers early market signals tailored specifically to business-to-business contexts. Explore the full AI tools suite to see where you can accelerate your existing workflow rather than replace it.
FAQ
What is cross-sector trend mapping?
Cross-sector trend mapping is the process of identifying and analysing signals from multiple industries to detect emerging patterns before they reach mainstream awareness. It uses frameworks like STEEP categories and impact vs timing matrices to prioritise which trends warrant strategic response.
How do you avoid false positives when scanning for signals?
Set a pre-agreed relevance threshold tied to your specific strategic questions before collecting data. Tagging signals by confidence level and cross-referencing them across multiple source types reduces the risk of acting on a single-source anomaly.
What is the difference between transplantation and translation in trend mapping?
Transplantation means copying a practice from another sector directly into your own context. Translation means identifying the underlying principle that made it work and adapting that principle to fit your specific conditions. Translation consistently outperforms direct replication.
How often should you revisit your trend map?
A quarterly review cadence works well for most organisations. Revisit signal tags, promote confirmed trends, retire stalled ones, and update scenario assumptions based on any trigger-point developments since the last cycle.
Where does AI add the most value in trend mapping?
AI adds most value in data acquisition, anomaly detection, and signal clustering across large, noisy datasets. Human judgement remains the critical input for assessing strategic relevance, contextual nuance, and translation into organisational decisions.