TL;DR:
- Academic trend mapping systematically visualizes shifts in research using bibliometric and computational analysis.
- It enables institutions to identify emerging topics up to 18 months before wide recognition, informing strategic decisions.
Academic trend mapping is the systematic identification and visualisation of patterns, shifts, and emerging themes within scholarly research to inform strategic academic planning. Known formally as bibliometric trend analysis, it draws on publication data, citation networks, and computational methods including natural language processing and network analysis to reveal how knowledge evolves across disciplines. Tools such as VOSviewer, Bibliometrix, and predictive platforms like BiBLoX have transformed what was once a manual, retrospective exercise into a real-time intelligence process. For educators, researchers, and academic institutions, understanding this discipline is no longer optional. It is the foundation of evidence-based curriculum design, research prioritisation, and funding strategy.
What is academic trend mapping and why does it matter?
Academic trend mapping, or bibliometric trend analysis, is defined as the systematic identification of research patterns by tracking publication volumes, citation flows, grant distributions, and conference themes to understand how academic knowledge evolves. It goes beyond counting papers. It reveals the epistemological, social, and political forces shaping what gets studied, funded, and published.
The practical value is direct. Universities use trend maps to prioritise research investment. Grant bodies use them to identify underfunded areas. Curriculum designers use them to ensure programmes reflect current and emerging knowledge rather than decade-old consensus. A department that maps the trajectory of artificial intelligence in education, for example, can redesign its postgraduate offerings two years before competitors recognise the shift.
Trend mapping reduces uncertainty by translating raw bibliometric data into directional signals that guide strategic planning and resource allocation. This distinction matters: the goal is not to predict the future with precision, but to reduce the range of plausible futures your institution must prepare for.
How academic trend mapping works: key methodologies and data sources
The process begins with bibliometric data, the structured metadata attached to scholarly outputs. This includes publication counts, citation frequencies, authorship networks, keyword co-occurrence, and journal classifications. Primary sources for this data are Scopus, Web of Science, and Google Scholar, each with different coverage strengths and disciplinary biases.
From this raw data, analysts apply several core techniques:
- Citation analysis: tracks how frequently a paper or author is cited, revealing influence and intellectual lineage within a field
- Co-citation analysis: identifies papers cited together repeatedly, uncovering conceptual clusters and research schools
- Bibliographic coupling: links papers sharing common references, mapping methodological and theoretical proximity
- Keyword co-occurrence analysis: reveals thematic clusters and how terminology shifts over time
- Network analysis: models relationships between authors, institutions, and topics as graphs to identify central nodes and emerging peripheries
Modern frameworks extend these techniques significantly. Computational methods combining NLP and network analysis achieve precision above 0.89 in predicting emerging research trends before mainstream recognition. This means a well-configured system can flag a rising research theme months before it appears in review articles or funding calls. Machine learning models trained on citation trajectories and semantic similarity scores classify topics into lifecycle phases: emergence, growth, maturation, and decline.
Pro Tip: Select your data source based on disciplinary coverage, not convenience. Scopus covers social sciences and humanities more broadly than Web of Science, which skews towards STEM. Using the wrong database introduces systematic bias before your analysis even begins.
Traditional versus modern computational trend mapping tools
Understanding the difference between legacy bibliometric software and current predictive platforms determines how much foresight your analysis can generate.
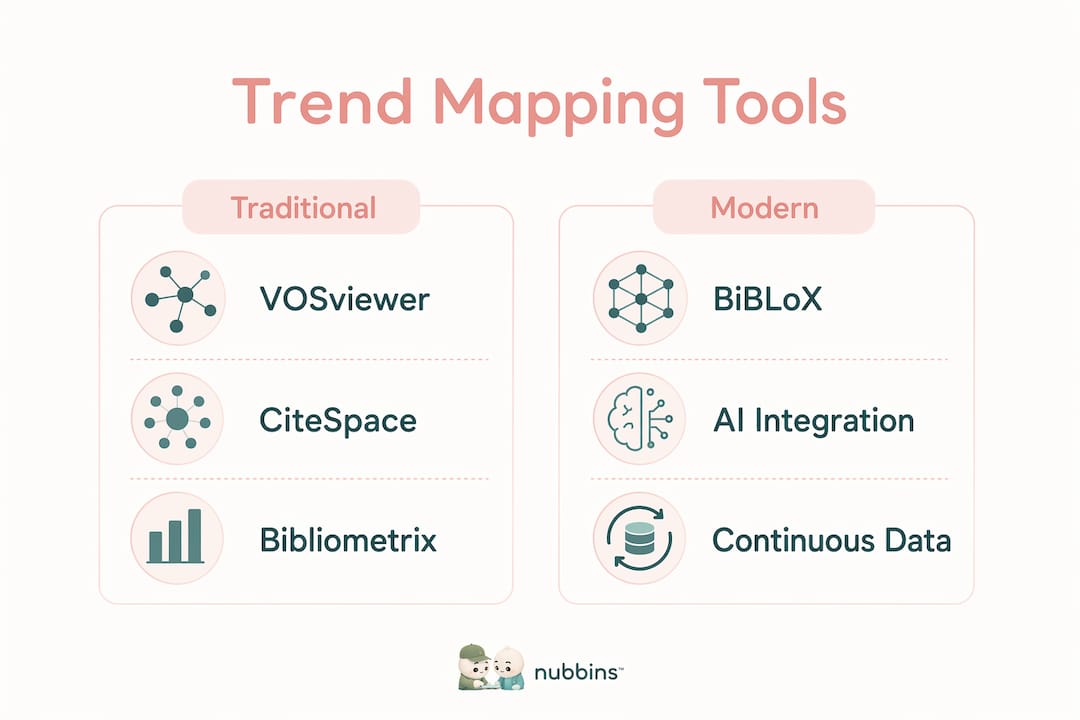
Traditional tools such as CiteSpace, VOSviewer, Gephi, and Bibliometrix are well-established and widely used in academic research. They produce high-quality visualisations of co-citation networks, keyword maps, and collaboration graphs. Their limitation is structural: traditional bibliometric tools are limited by retrospective analysis and manual data gathering, making them unable to capture real-time scientific shifts effectively. You are always looking backwards.
Modern platforms address this directly. BiBLoX, for instance, integrates continuous data streams with supervised and unsupervised machine learning models to deliver real-time forecasting and dynamic visualisation. The contrast is significant.
| Feature | Traditional tools (VOSviewer, CiteSpace) | Modern platforms (BiBLoX) |
|---|---|---|
| Data acquisition | Manual, periodic downloads | Continuous, automated harvesting |
| Analysis type | Retrospective and descriptive | Predictive and dynamic |
| Predictive capability | None | Machine learning forecasting |
| Visualisation | Static network maps | Interactive, real-time dashboards |
| Typical application | Literature reviews, grant reports | Strategic foresight, funding positioning |
| User accessibility | High, open-source options available | Specialist setup required |
The practical implication is that trend evolution frameworks detect research developments approximately 18 months before widespread academic recognition. For a research director deciding where to concentrate doctoral supervision or infrastructure investment, that window is the difference between leading a field and following it.
Pro Tip: Do not discard traditional tools entirely. VOSviewer and Bibliometrix remain excellent for producing publication-ready visualisations and for exploratory analysis when you are entering an unfamiliar field. Use them alongside predictive platforms rather than instead of them.
Why academic trend mapping matters: strategic applications and impact
The strategic applications of educational trend mapping extend across every level of an academic institution, from individual researchers to university leadership.
At the institutional level, trend mapping supports research prioritisation by identifying which topics are gaining citation momentum and which are saturating. A university investing in quantum computing research in 2021 based on trend signals would have positioned itself ahead of the subsequent surge in funding and collaboration. At the departmental level, mapping uncovers interdisciplinary opportunities that subjective expert judgement routinely misses. Visualisation of scientific landscapes benefits the discovery of novel collaboration opportunities by providing comprehensive, objective views of academic fields that no single expert can hold in their head.
A bibliometric study covering 2019 to 2024 used VOSviewer and PRISMA guidelines to identify four distinct research clusters in educational technology, illustrating how interdisciplinary innovation reshapes fields over relatively short periods. That kind of structured retrospective analysis, when combined with forward-looking prediction, gives curriculum designers a clear basis for updating module content and learning outcomes.
The top benefits for educators and academic institutions are:
- Research prioritisation: data-driven identification of high-momentum topics for doctoral and postdoctoral investment
- Grant strategy: alignment of funding applications with demonstrably emerging areas rather than saturated ones
- Curriculum currency: evidence-based updates to programmes reflecting real shifts in knowledge, not editorial opinion
- Collaboration discovery: identification of understudied intersections where cross-disciplinary partnerships generate disproportionate impact
- Risk reduction: early warning of declining research areas before significant resources are committed
Understanding how trends shape strategic decisions applies directly to academic contexts, where resource cycles are long and course corrections are costly.
Pro Tip: Embed trend mapping outputs directly into your institution's annual research strategy document. A one-page visual summary of emerging and declining themes, updated annually, gives leadership a shared reference point and reduces the influence of departmental lobbying on resource allocation.
What are the main challenges in academic trend mapping?
Trend mapping analysis is not without significant complications, and understanding them prevents costly misinterpretation.
The most common difficulty is separating structural trends from noise. Effective trend analysis distinguishes long-term trends from seasonal cycles, short-term volatility, and one-off events such as a single high-profile paper generating a citation spike. Without rigorous statistical decomposition, a temporary surge in publications following a major conference can be misread as a sustained emerging field.
Additional challenges include:
- Data source bias: Scopus and Web of Science index journals unevenly across regions and disciplines, meaning some fields appear smaller or less active than they are
- Inconsistent indexing: author name disambiguation, keyword standardisation, and institutional affiliation matching introduce errors that compound across large datasets
- Geographic and linguistic coverage gaps: research published in non-English languages or in regional journals is systematically underrepresented in major databases
- Epistemological and social factors: funding cycles, policy priorities, and high-profile controversies shape publication patterns in ways that purely data-driven models cannot fully account for
- Over-reliance on automation: machine learning models trained on historical patterns can miss genuinely novel paradigm shifts that have no precedent in the training data
The risk of over-reliance on automated tools without critical expert assessment is real. A model trained on citation data from 2010 to 2020 would not have predicted the speed or character of the large language model research explosion in 2022 and 2023. Human expertise remains the necessary interpretive layer above any automated system. For guidance on identifying meaningful signals in complex trend data, the principles of signal-to-noise separation apply directly to academic contexts.
How to start using academic trend mapping in practice
Getting started with academic mapping techniques does not require a dedicated data science team. A structured workflow makes the process accessible to individual researchers and small academic units.
The core steps are:
- Define your scope: specify the discipline, sub-field, time window, and research question before touching any data. Vague scope produces uninterpretable maps.
- Collect and clean your data: export records from Scopus or Web of Science using consistent search strings. Remove duplicates, standardise author names, and verify keyword consistency before analysis.
- Select your tools: VOSviewer is free, widely documented, and produces publication-quality network maps. Bibliometrix, an R-based package, offers greater analytical depth for users comfortable with scripting. For predictive capability, platforms with AI-driven trend discovery extend the analysis beyond retrospective description.
- Analyse patterns: run co-citation, keyword co-occurrence, and collaboration network analyses. Identify clusters, central nodes, and peripheral topics gaining citation momentum.
- Interpret findings: map lifecycle phases to each identified cluster. Distinguish topics in emergence from those in decline. Cross-reference with funding databases and conference programmes to validate signals.
- Report and apply: produce visualisations calibrated to your audience. A research committee needs a different level of detail than a curriculum review panel.
Pro Tip: Set your analysis intervals deliberately. A five-year window smooths out noise but may obscure rapid emergence. A two-year window captures recent momentum but risks over-weighting temporary spikes. Run both and compare before drawing conclusions.
Learning resources include the VOSviewer documentation, the Bibliometrix vignettes on CRAN, and the growing catalogue of bibliometric methodology papers in Scientometrics and the Journal of Informetrics. For a structured approach to forecasting trends step by step, the same frameworks used in market intelligence translate directly to academic research planning.
The shift I have watched reshape academic strategy
When I first encountered bibliometric analysis, it was a tool for writing literature reviews, not for making decisions. Researchers used VOSviewer to produce a colourful network map, include it in a paper, and move on. The idea that the same data could drive a university's five-year research strategy felt like a stretch.
That has changed completely. The transition from retrospective description to predictive intelligence is not incremental. It is a different activity with different stakes. Institutions that treat trend mapping as a strategic function, rather than a reporting exercise, are making resource decisions with a materially better information base than those that do not.
What I have found in practice is that the biggest barrier is not technical. Most researchers can learn VOSviewer in an afternoon. The barrier is interpretive. Knowing that a topic cluster is growing at 34% annually in citation volume tells you something. Knowing whether that growth reflects genuine intellectual momentum or a funding-driven publication surge requires contextual judgement that no algorithm provides.
My honest position is that the future of academic planning belongs to institutions that combine automated trend detection with experienced human interpretation. The tools are getting faster and more accurate. Predictive bibliometric platforms are transitioning academia from reactive, manual bibliometrics to fully integrated automated pipelines. But the researchers and educators who will benefit most are those who treat these outputs as evidence to interrogate, not conclusions to accept.
Start with one research question. Map it properly. See what the data shows that your intuition missed. That first exercise tends to be persuasive.
— Aidil
Explore academic trend mapping with Ontherice
Ontherice is built for exactly this kind of intelligence work. The platform uses multiple AI engines to scan global data, extract meaningful signals, and surface emerging trends before they reach mainstream awareness, which maps directly onto what academic professionals need from trend analysis.
For researchers and educators looking to apply these methods, the AIOpportunities tool identifies and forecasts academic and research opportunities using real-time data, supporting strategic planning in education and research sectors. The AI tools collection extends this with predictive bibliometrics and trend analysis capabilities suited to both individual researchers and institutional teams. Ontherice makes the analytical infrastructure accessible without requiring a dedicated data science function.
FAQ
What is academic trend mapping in simple terms?
Academic trend mapping is the process of systematically tracking and visualising shifts in scholarly research using bibliometric data, citation analysis, and computational tools. It reveals which topics are emerging, growing, or declining within a field.
How is academic trend mapping different from a literature review?
A literature review summarises existing knowledge on a topic. Academic trend mapping analyses the structural patterns and trajectories of that knowledge over time, identifying momentum, gaps, and interdisciplinary connections rather than simply cataloguing what has been written.
Which tools are used for academic trend mapping?
The most widely used tools are VOSviewer, Bibliometrix, CiteSpace, and Gephi for visualisation and retrospective analysis. Predictive platforms such as BiBLoX add real-time data harvesting and machine learning forecasting for forward-looking intelligence.
How accurate is predictive trend mapping?
Modern computational frameworks combining NLP and network analysis achieve precision above 0.89 in predicting emerging research trends. Trend evolution frameworks can detect research developments approximately 18 months before widespread academic recognition.
Can academic trend mapping support curriculum development?
Academic trend mapping directly informs curriculum design by identifying which knowledge areas are gaining momentum and which are becoming outdated. A bibliometric study of educational technology from 2019 to 2024 identified four distinct research clusters that illustrate how rapidly interdisciplinary shifts reshape what students need to learn.
Key takeaways
Academic trend mapping works because it combines bibliometric data, computational analysis, and human interpretation to convert raw publication patterns into strategic foresight for research and curriculum decisions.
| Point | Details |
|---|---|
| Core definition | Academic trend mapping systematically identifies and visualises shifts in scholarly research using bibliometric and computational methods. |
| Predictive capability | Modern frameworks detect emerging research topics up to 18 months before mainstream academic recognition. |
| Tool selection matters | Traditional tools like VOSviewer suit retrospective analysis; predictive platforms like BiBLoX add real-time forecasting. |
| Strategic applications | Trend mapping supports research prioritisation, grant strategy, curriculum updates, and interdisciplinary collaboration discovery. |
| Critical interpretation required | Automated outputs must be validated by expert judgement to distinguish structural trends from noise and data artefacts. |