
Streaming analytics for markets is the practice of processing ticks, order-book updates, fills, and news the instant they occur, rather than after the fact, so a firm can react within milliseconds instead of hours. It underpins live surveillance, faster execution decisions, and fresher risk dashboards. Reaction times typically run within a range from sub-millisecond to a few milliseconds depending on the pipeline.
TL;DR:
- Streaming analytics delivers responses within milliseconds, making it essential for order-book monitoring, real-time surveillance, and immediate risk assessments.
- Event-time processing is crucial to handle late, duplicated, or out-of-order data, preventing drift in calculations like VWAP and ensuring data accuracy.
- The most effective pipelines incorporate reconciliation layers, low-latency engineering, and parallel batch processes to prevent data drift and maintain system trustworthiness.
- Market applications requiring ultra-low latency, such as order execution and fraud detection, operate in the sub-millisecond to second range, while longer windows tolerate simpler infrastructure.
- Managed cloud tools and specialized databases reduce operational complexity, but the choice depends on how critical latency is and available engineering resources.
Table of Contents
- What counts as streaming analytics in market data?
- How does a streaming analytics pipeline actually work?
- When should you use streaming analytics instead of batch?
- Which tools handle streaming analytics for market data?
- Where does streaming analytics actually move the needle in markets?
- What are the real benefits and the practical pain points?
- What advanced techniques do practitioners actually rely on?
- What do successful market implementations actually look like?
- What security and compliance issues come with market streaming analytics?
- How do early signals change the way trading teams actually work?
- Where OnTheRice fits into your streaming analytics stack
- Sources
- FAQ
What counts as streaming analytics in market data?
Streaming analytics processes data in motion. Batch analytics waits for data to land, then runs a job against it. That distinction sounds academic until you're staring at a risk breach that happened four minutes ago and your batch report only just told you. Streaming systems react to fluctuations within very low-latency windows typically measured in milliseconds or less, while batch jobs, however well scheduled, always carry latency baked in.
Market data comes in several distinct streaming forms, each with different shapes and update rates:
- Tick data: individual trade prints, often thousands per second on liquid instruments.
- Order book updates: adds, cancels, and modifies that reconstruct depth and imbalance.
- Fills and execution reports: confirmations that feed post-trade analytics and TCA.
- News and sentiment feeds: unstructured or semi-structured text requiring enrichment before it's usable.
- Reference and static data: instrument metadata, corporate actions, calendars.
Event semantics matter more here than in most streaming domains. A tick can arrive late, out of order, or duplicated across a failover. Getting event-time processing right, distinguishing when something happened from when your system saw it, is what separates a pipeline that's merely fast from one that's also correct. Miss that distinction and your VWAP calculation quietly drifts from reality.
How does a streaming analytics pipeline actually work?
Every market streaming system, however it's branded, breaks down into the same three stages: ingestion, processing, and output. The engineering choices inside each stage decide whether the pipeline survives a volatile open.
- Ingestion pulls data from exchange feeds or message brokers. Providers increasingly ship this over persistent, recoverable connections; Euronext's Stream Pro service, for instance, delivers Kafka-protocol feeds built for low-latency delivery with built-in recovery if a consumer drops.
- Processing runs on stateful stream engines that maintain running aggregates, windows, and joins without waiting for a batch cycle to close. This is where windowing logic, watermarks, and state stores live.
- Sinks write results out to materialised views, time-series stores, or data lakes for downstream consumption, dashboards, model features, or compliance archives.
Windowing and state management are the trickiest part of stage two. A five-minute VWAP window needs to know how to handle a tick that arrives six seconds late, whether to update the window retroactively or discard it. Fault tolerance adds another layer: state has to survive a process restart without silently losing counts. Streaming SQL platforms have made some of this easier: RisingWave and comparable engines support as-of joins and materialised views with millisecond latency and strong consistency, which cuts a lot of the custom state-handling code teams used to write by hand.
Pro Tip: Decide your event-time versus processing-time policy before you write a single aggregation. Retrofitting watermark logic onto a pipeline that's already in production is far harder than designing it in from day one.
Storage trade-offs follow from these choices. Keep more state in memory for lower latency, or checkpoint aggressively for faster recovery, but rarely both at once.
When should you use streaming analytics instead of batch?
Neither approach wins outright; each suits a different job.
- Streaming wins when the cost of a stale decision exceeds the cost of extra infrastructure, think execution signals, live risk breaches, and surveillance alerts.
- Batch wins for backtesting, month-end reconciliation, and anything where a few hours of latency changes nothing.
- Hybrid patterns are increasingly the norm: stream in live signals for decisioning, then reconcile against a nightly batch run to catch drift or data-quality issues the streaming layer missed.
Cost and complexity scale with latency ambition. A pipeline chasing single-digit-millisecond reaction times needs specialised infrastructure and constant tuning; a pipeline that tolerates five-minute staleness can run on considerably simpler plumbing. Most trading desks land somewhere in between, streaming the signals that move markets fast and batching the reconciliation that proves those signals were right.
Which tools handle streaming analytics for market data?
Tooling splits into a handful of categories, and knowing which one solves which problem saves months of trial and error.
- Message brokers and exchange feeds handle ingestion at the front door. Exchange-native services like Euronext Stream Pro deliver Kafka-protocol streams with recovery built in, so you're not reinventing reconnection logic.
- Stream processing engines run the stateful logic, windowing, joins, aggregation, and typically expose either a SQL-like interface or a code-first API.
- Time-series databases store the output at scale. QuestDB is built specifically for nanosecond timestamps and order-book analytics, with efficient downsampling to Parquet for backtesting and compliance reporting.
- Managed cloud stream services bundle ingestion, processing, and warehousing into one operational surface. Google Cloud's Pub/Sub, Dataflow, and BigQuery combination is a common example, and it autoscales through volatile sessions without a team manually provisioning capacity.
- SDKs and visualisation libraries sit on top, turning processed streams into dashboards and analyst-facing tools.
Each category trades something for something else. Managed cloud services reduce operational burden but add per-query cost that adds up at high tick rates. On-premises deployments with dedicated hardware buy you latency control but demand a team that can keep the lights on at 3am during a volatility spike. There's no universally correct answer; the right stack depends on how much latency actually matters for your specific signal, and how much engineering headcount you have to run it.
Where does streaming analytics actually move the needle in markets?
Three use cases account for most of the value teams report, each with its own latency bar.
- Order-book monitoring and execution signals. Reconstructing depth and imbalance in real time drives smart order routing and short-horizon execution decisions. Target latency here sits in the sub-millisecond to low-millisecond range; anything slower and the signal has already decayed.
- Real-time surveillance and anomaly detection. Streaming systems combine live event streams with static reference data to flag suspicious patterns, spoofing, layering, unusual volume spikes, as they happen rather than in a next-day compliance report. IBM notes this pairing of live streams with reference data is now standard practice across enterprise surveillance and fraud-detection functions, not just trading desks. Alerts here typically need to land within seconds, not minutes.
- Pre-trade risk, TCA, and live risk dashboards. Pre-trade checks need to clear before an order hits the market, which means risk limits have to be evaluated in the same millisecond window as the order itself. Post-trade, transaction cost analysis and live risk dashboards run on slightly relaxed windows, seconds rather than milliseconds, but still far faster than an end-of-day batch job.
A typical pipeline supporting all three might ingest ticks over a low-latency feed, maintain rolling order-book state in a stream processor, write aggregates into a time-series store for dashboards, and fork a parallel branch into an anomaly detector watching for pattern breaks. None of that requires exotic hardware; it requires disciplined engineering around state and time.
What are the real benefits and the practical pain points?
The benefits are genuine but so are the operational headaches, and pretending otherwise sets teams up for a bad quarter.
Faster decisions, sharper surveillance, and fresher machine-learning features top the benefit list. A model retrained hourly on streaming features usually outperforms the same model retrained nightly, simply because it's seeing more current market conditions.
The challenges cluster around a few recurring failure modes:
- Clock skew between feed sources and internal clocks, throwing off event-time ordering.
- Late-arriving data that shows up after a window has already closed.
- State size growth, especially for order-book reconstruction over illiquid instruments held for long windows.
- Data quality gaps, missing ticks, duplicate fills, malformed messages.
- Scaling under volatility, when tick rates spike tenfold in a market open and infrastructure sized for average load buckles.
Pro Tip: Build a fallback to batch into every streaming pipeline from day one. When the stream degrades, and it will during a volatile session, you want a known-good batch calculation to fall back on rather than a blank dashboard.
Reconciliation checks, proper observability (not just uptime, but data-quality metrics), and honest capacity planning ahead of known volatility events address most of this before it becomes an incident.
What advanced techniques do practitioners actually rely on?
Two techniques separate pipelines that work in a demo from pipelines that survive a live trading day: reconciliation discipline and low-latency engineering.
Reconciliation is the unglamorous work that catches the errors nobody notices until a client complains. dbt-style reconciliation pipelines compute the same aggregation logic over both the streaming path and a batch reconstruction, then diff the two and alert on defined thresholds, flags like VWAP_MISMATCH or MISSING_STREAMING catch drift before it reaches a report. Without this layer, a subtle bug in your windowing logic can run for weeks before anyone spots the discrepancy.
Low-latency engineering is the other half. Pipelines that need to hold stable latency under heavy tick rates avoid runtime allocation on the hot path entirely. Libraries built for this, such as the fin-stream crate, favour languages like Rust specifically to skip garbage-collection pauses, and expose hundreds of pre-built rolling-window analytics so teams aren't rewriting the same moving-average logic badly, five times, in five services.
A few patterns show up repeatedly in mature implementations:
- As-of joins to line up asynchronous streams (a trade against the reference rate that applied at that instant), preserving audit-friendly time-travel queries.
- Materialised views that keep a consistent, queryable snapshot without recomputing from scratch on every read.
- Durable state stores with checkpointing, so a process restart doesn't wipe hours of accumulated aggregates.
- Continuous testing against replayed historical sessions, not just synthetic data, to catch edge cases real volatility produces.
One useful proxy for the value of the reconciliation layer: Google's managed streaming stack autoscales the processing tier automatically under load, but autoscaling doesn't catch a logic bug, only a reconciliation diff does.
What do successful market implementations actually look like?
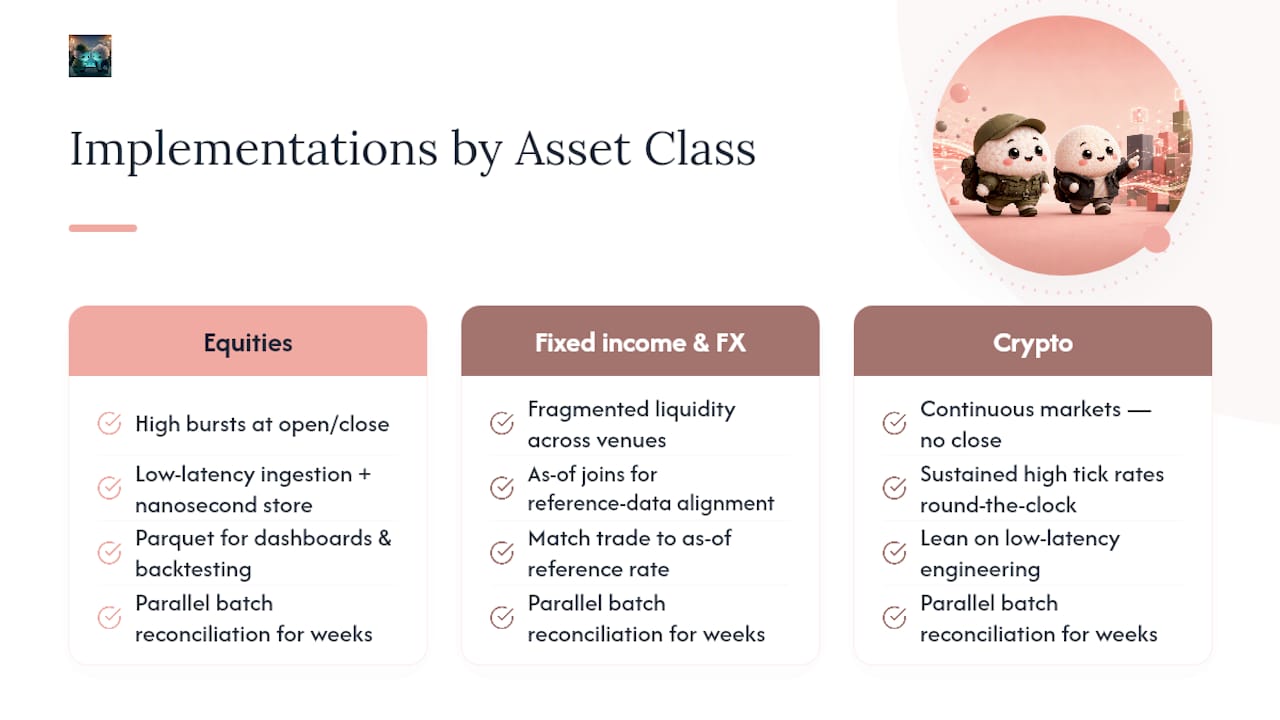
Patterns repeat across asset classes even when the specifics differ. In equities, firms running order-book reconstruction pipelines typically pair a low-latency ingestion layer with a time-series store tuned for nanosecond timestamps, exactly the profile QuestDB was built for in capital markets deployments, where downsampling to Parquet supports both real-time dashboards and after-the-fact backtesting from the same underlying data.
In fixed income and FX, where liquidity is more fragmented across venues, the harder problem is often reference-data alignment rather than raw throughput. Streaming platforms that support as-of joins let a desk match a trade against the reference rate that applied at the precise instant of execution, which matters enormously for TCA accuracy when rates move between quote and fill.
Crypto markets, running continuously with no close, push a different stress: sustained high tick rates around the clock rather than concentrated bursts at an open or close. Pipelines built for that environment lean harder on the low-latency engineering techniques discussed above, since there's no overnight lull to catch up on backlog.
A common thread across all three: the firms that report the smoothest rollouts are the ones that ran a parallel batch reconciliation layer for weeks before trusting the streaming output alone. That patience up front consistently prevents the kind of quiet data-quality drift that erodes trust in a live system after the fact.
What security and compliance issues come with market streaming analytics?
Live market data pipelines create a different risk profile than batch systems, mainly because there's no overnight window to patch, audit, or pause.
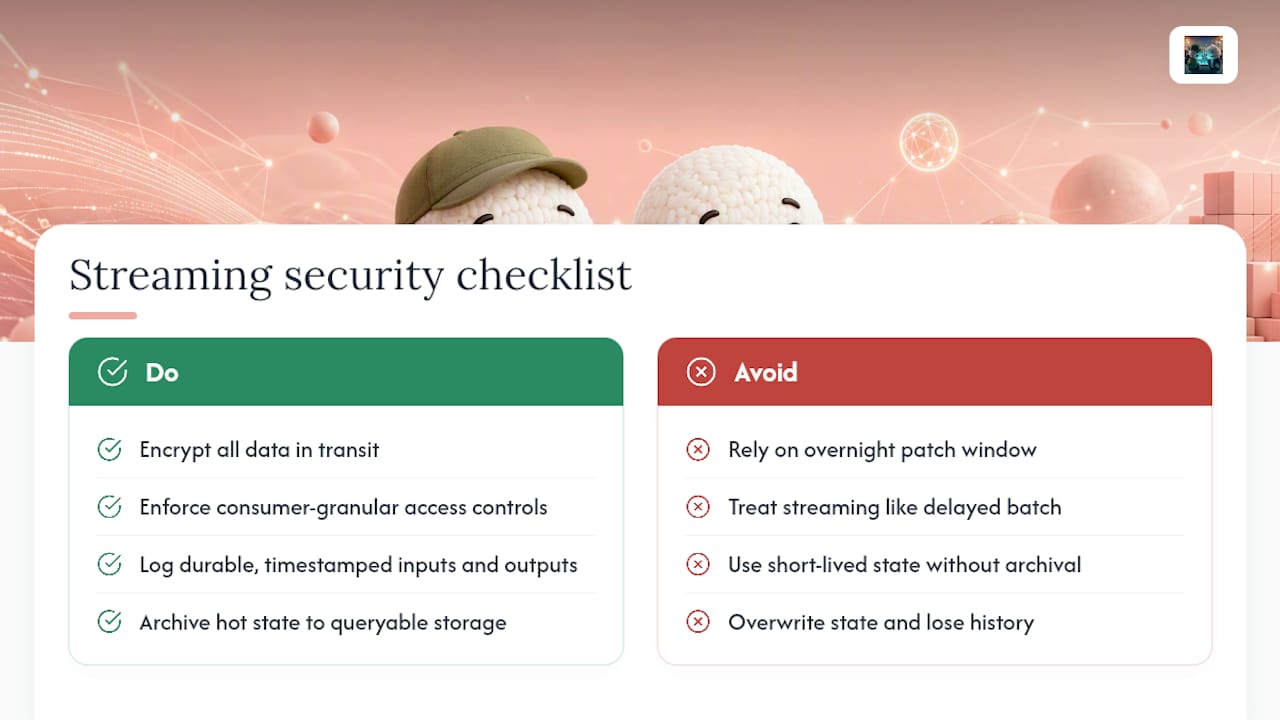
Data in motion still needs encryption in transit, particularly across feed connections from exchanges and market-data vendors, and access controls need to work at stream-consumer granularity rather than just at the database level. A consumer with broad read access to a live order-book stream is a bigger exposure than the same access to a delayed batch export, because the streaming version is actionable the moment it's read.
Surveillance and audit requirements push in the opposite direction from raw speed. Regulators generally expect a reconstructable record of what a system knew and when it acted, which means every streaming pipeline handling trading decisions needs durable, timestamped logs of inputs and outputs, not just the final aggregate. Materialised views and as-of joins help here, since they preserve audit-friendly time-travel queries rather than overwriting state in place.
Data retention policy matters more in streaming systems than teams expect. State stores optimised for low latency often default to compact, short-lived representations, which can conflict with retention rules that require years of reconstructable history. Building a clear archival path from hot state into durable, queryable storage from the outset avoids a scramble later when an auditor asks for a reconstruction from eighteen months back.
How do early signals change the way trading teams actually work?
Once a desk sees a signal within seconds instead of the next morning, the whole decision cycle compresses. Meetings that used to review yesterday's data start reviewing what's happening right now, and that shift changes who gets consulted and how fast.
A signal is only useful if the person acting on it understands why it fired. A signal is only useful if the person acting on it understands why it fired. Our explainable AI approach to live market intelligence reflects that principle directly. Teams adjusting to streaming workflows tend to underestimate how much process, not just technology, has to change alongside the tooling.
— Aidil
Where OnTheRice fits into your streaming analytics stack
Building a full streaming analytics pipeline from scratch, feeds, processors, reconciliation layers, and all, is a serious engineering commitment. Some platforms offer a managed intelligence layer that scans public data across finance, crypto, products, and jobs, and surfaces ranked, scored signals before they hit mainstream awareness.
For teams that want raw signal discovery across sectors, GeneralSignals is the starting point, generating ranked feeds without you needing to build ingestion infrastructure first. If your interest sits specifically in real-time trend detection with an explainable trail behind each score, the AI opportunity discovery tools extend that further into live querying. Both sit on Ontherice's freemium model: core rankings and signal exploration are free, and Access Points unlock deeper feeds, premium signal cards, and advanced analysis when you need more than the surface view.
Getting started typically requires creating an account, running a live query against a sector of interest, and then deciding whether deeper feeds are worth a paid upgrade.
Sources
For deeper technical grounding, IBM's overview of streaming analytics explains the enterprise use cases in more depth, while the fin-stream crate documentation is worth a look for anyone implementing low-latency rolling-window analytics directly.
This article is general information, not a substitute for advice from a qualified financial advisor. Consult a qualified financial professional about your own circumstances before acting on anything here.
- Real time data streaming: 4 use cases, 5 components and 6 best practices
- What Is Streaming Analytics? | IBM
- QuestDB for Capital Markets
- Capital Markets | RisingWave
- Euronext Stream Pro
FAQ
What is streaming analytics for markets?
It's the processing of market data, ticks, order books, fills, news, as it's generated so decisions can be made within milliseconds rather than after a batch job completes.
How is streaming analytics different from batch analytics?
Streaming processes data in motion for near-instant reaction, while batch analytics works on data at rest and introduces inherent latency, often hours between collection and insight.
What latency should I expect from a market streaming pipeline?
Well-built pipelines typically react in sub-millisecond to millisecond timeframes for execution signals, with surveillance alerts and risk dashboards often running in a slightly wider seconds-level window.
What tools are commonly used for market streaming analytics?
Categories include exchange feed services, stateful stream processors, time-series databases like QuestDB, streaming SQL engines such as RisingWave, and managed cloud stacks like Google Cloud's Pub/Sub and Dataflow.
Can I get early market signals without building a full pipeline?
Yes. Platforms like Ontherice's GeneralSignals scan public data and surface ranked, explainable signals without requiring you to build ingestion or processing infrastructure yourself.