
Effective market monitoring best practices come down to one discipline: define a small trend territory, pick 2–3 complementary data sources, score every signal for commercial relevance, and route high-scoring alerts into a daily triage habit. Platforms like Ontherice operationalise this with multi-AI ranking and transparent accuracy tracking, while model metrics such as MSE, perplexity, and FID/SSIM tell you whether the underlying outputs are trustworthy enough to act on.
Start here — your 15-minute setup checklist:
- Define 3–5 category keywords that mark your trend territory (e.g. "AI agents", "vertical SaaS", "supply chain visibility")
- Choose 2–3 sources: one search/AI query feed, one social listening channel, one owned data source (CRM or support logs)
- Set a scoring threshold and alert rule: cross-source confirmation + velocity spike = escalate
- Route alerts to Slack or a shared inbox for daily triage
- Block 15 minutes each morning to review and tag signals as "act", "watch", or "discard"
- Run a weekly one-page synthesis: top three signals, recommended actions, owner assigned
- Map every signal to at least one KPI before it reaches a decision-maker
Pick two items from that list and implement them today. The rest follows once the habit is in place.
Key takeaways
Effective market monitoring requires a small keyword set, named ownership, daily triage, and KPIs tied directly to business decisions — not just signal volume.
| Point | Details |
|---|---|
| Keep the territory small | Define 3–5 category keywords; expand only after the daily triage habit is established. |
| Score before you alert | Require cross-source confirmation and velocity data before any signal reaches a human reviewer. |
| Map metrics to decisions | Track MSE, perplexity, and actionability score alongside business KPIs like time from signal to action. |
| Name a single owner | Programmes with shared triage ownership produce briefs that nobody acts on. |
| Ontherice as your pilot layer | Use Ontherice's multi-AI ranking and transparent accuracy tracking to validate signals before scaling to paid Access Points. |
Table of Contents
- What does market monitoring actually mean here?
- Which sources give you the best early signals?
- How do you turn raw data into a decision-ready signal?
- How do MSE, perplexity, FID/SSIM and business KPIs connect?
- What does a working operational cadence look like?
- What technology stack and team do you actually need?
- How do you prove ROI and keep the system honest?
- An Ontherice pilot: the best practices in action
- What actually separates good monitoring from expensive noise
- Ontherice gives you a working pilot in six weeks
- Sources
What does market monitoring actually mean here?
This guide covers AI-powered, continuous monitoring of public data for trend and signal detection. It does not cover regulatory market surveillance, compliance monitoring, or competition-law oversight — those are separate disciplines with different audiences and tooling.
The goal here is decision-ready intelligence: spotting what is gaining momentum before it reaches mainstream awareness, so your team can act rather than react. That means monitoring for early signals across search behaviour, social conversation, AI query patterns, product reviews, hiring activity, and deal flows.
Choosing the right objectives is where most programmes stall. The most useful framing is to ask: what decision will this signal inform, and within what timeframe? Practical market analysis tips suggest anchoring objectives to outcomes your team will act on within 4–6 weeks, not to vanity metrics like "awareness of trends."
A workable initial KPI set covers two types. Direct KPIs measure the monitoring system itself: signal-to-action time, alert accuracy rate, and the proportion of weekly brief items that generate a decision. Indirect KPIs measure downstream effects: product roadmap changes influenced, sales pipeline acceleration, and customer satisfaction shifts.
Pro Tip: Set a 6-week review gate. If a KPI has not driven a single decision in six weeks, replace it with one that will.
Objectives worth monitoring include: early competitive signals, emerging buyer-intent patterns, product-feature gaps surfaced by reviews, hiring signals that reveal competitor priorities, and partnership or deal activity.
Which sources give you the best early signals?
Source selection determines how early you detect a trend, not just whether you detect it. AI visibility data tends to surface buyer-intent signals with several weeks' lead time ahead of traditional research methods, making it one of the highest-leverage inputs for product and strategy teams. That lead time shrinks fast if you rely on a single source.

| Source | Typical lead time | Best use case |
|---|---|---|
| AI query patterns (ChatGPT, Perplexity, Gemini) | 4–6 weeks | Buyer-intent and emerging topic discovery |
| Search query trends | 2–6 weeks | Category demand and keyword velocity |
| Social listening (Reddit, X, forums) | 1–4 weeks | Sentiment, product complaints, niche communities |
| Product reviews | 1–3 weeks | Feature gaps, competitor weaknesses |
| Patent and job feeds | 4–6 weeks | Competitor R&D direction and hiring priorities |
| Pricing and product pages | Real-time | Competitive positioning shifts |
| Owned data (CRM, support logs) | Real-time | Customer-specific intent signals |
Hybrid, multi-source approaches that combine time-series anomaly detection, NLP clustering, and cross-source correlation detect trends earlier than single-source tools. The practical implication: a signal that appears in AI query data and Reddit and job postings simultaneously carries far more weight than one appearing in only one place.
Data quality matters as much as source selection. Check each source for coverage gaps (does it capture non-English conversations?), freshness (how often is it updated?), and structural bias (does it over-represent certain demographics or geographies?). A source that looks comprehensive but refreshes weekly will miss fast-moving signals entirely.
How do you turn raw data into a decision-ready signal?
Raw ingestion is just noise. The pipeline that converts it into something a strategist can act on has six steps: ingest, normalise, enrich, score, confirm, and triage.
AI systems detect signals faster by processing breadth and using cross-source confirmation, but they also produce false positives at scale. Human validation is not optional — it is the step that separates a useful monitoring programme from an alert-fatigue machine.
A practical scoring rubric assigns weight to four factors:
- Proximity to territory: does the signal sit within your defined 3–5 keyword set?
- Commercial relevance: does it connect to a buyer decision, a product feature, or a revenue line?
- Cross-source confirmation: does the same signal appear in at least two independent sources?
- Velocity and sentiment direction: is it accelerating, and is the sentiment net positive or negative?
Only signals that clear a threshold on all four factors should reach a human reviewer. Everything else gets logged and reviewed weekly in aggregate.
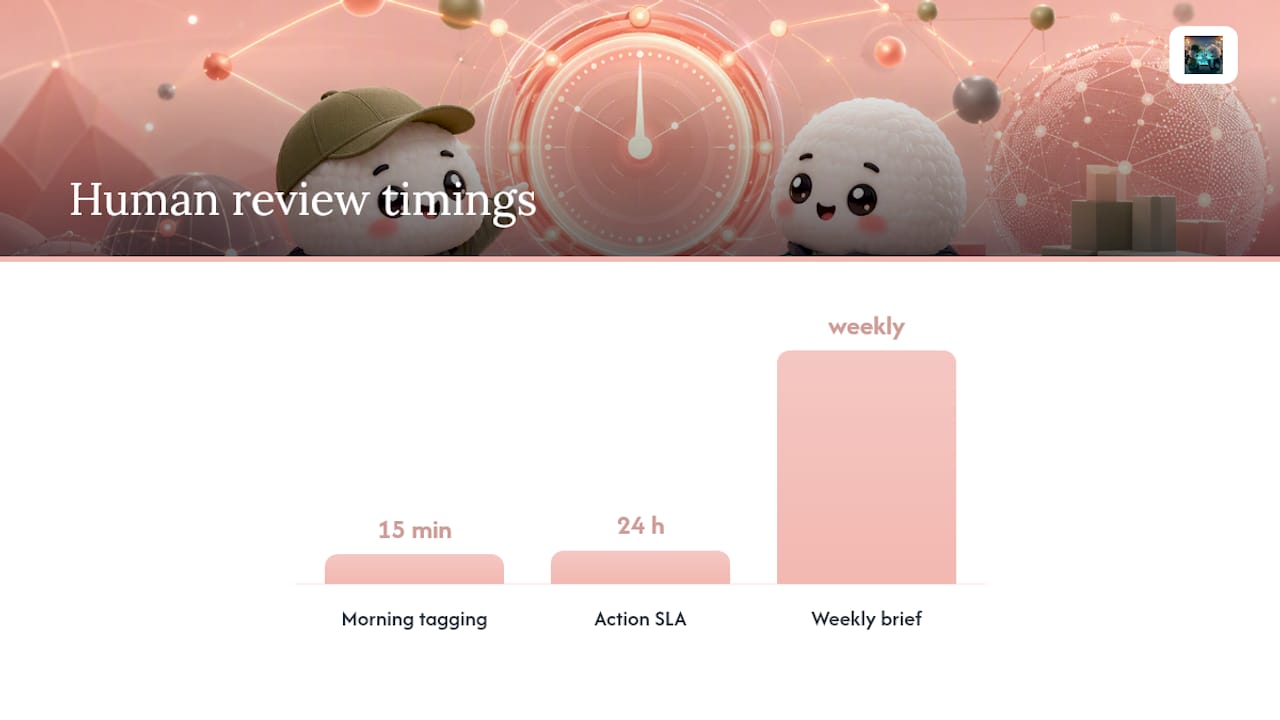
Human-in-the-loop rules keep the system honest. The monitoring owner spends 15 minutes each morning tagging alerts. Anything tagged "act" goes to a product owner or campaign lead within 24 hours. The weekly one-page brief covers the top three confirmed signals, the recommended action for each, and the owner responsible.
Pro Tip: Require an explainability field on every alert — a one-line note stating why it scored above threshold. Alerts without a reason get ignored, and ignored alerts kill adoption.
For teams exploring no-code signal processing in adjacent domains, QuantGenie's algorithm builder offers a useful reference for how scoring rules can be configured without engineering overhead.
How do MSE, perplexity, FID/SSIM and business KPIs connect?
Measuring AI success requires both technical model metrics and business-facing KPIs. The model metrics tell you whether the AI output is reliable; the business KPIs tell you whether it is valuable.
| Metric | What it measures | Business decision it informs |
|---|---|---|
| MSE (Mean Squared Error) | Prediction accuracy for regression outputs | Confidence in trend-velocity forecasts |
| Perplexity | Language model output coherence | Reliability of NLP-generated signal summaries |
| FID (Fréchet Inception Distance) | Quality of AI-generated image outputs | Relevance of visual trend content |
| SSIM (Structural Similarity Index) | Image fidelity vs. reference | Consistency of visual signal outputs |
| First contact resolution rate | Automated response accuracy | Efficiency of AI-assisted triage |
| Content relevance score | Signal-to-brief alignment | Quality of weekly synthesis |
| Time from signal to action | Operational speed | Competitive advantage realised |
| Actionability score | Proportion of signals driving decisions | ROI of the monitoring programme |
Indirect KPIs — customer satisfaction, user engagement rate, and innovation score — matter too, but they lag. Build your measurement plan around the direct metrics first, then layer in indirect ones once the programme is stable.
What does a working operational cadence look like?
A practical trend-monitoring workflow runs on four rhythms: real-time alerting, daily triage, weekly synthesis, and monthly pruning.
- Real-time: alerts routed to Slack when a signal clears the scoring threshold; no action required, just visibility
- Daily (15 minutes): monitoring owner reviews the Slack feed, tags each alert, escalates "act" items
- Weekly (60 minutes): analyst produces a one-page brief covering the top three signals, recommended actions, and assigned owners; brief goes to product and strategy leads
- Monthly (30 minutes): prune the keyword set, retire sources that are consistently low-signal, and recalibrate thresholds based on false-positive rate
Alert tiers prevent fatigue. A tier-one alert (cross-source confirmation + high velocity) demands same-day review. A tier-two alert (single source, moderate velocity) goes into the weekly brief. A tier-three signal (low velocity, no confirmation) is logged only.
Simple playbooks for common scenarios:
- Content response: a tier-one signal on a competitor topic triggers a content brief within 48 hours
- Product discovery: a cluster of review signals pointing to an unmet need goes to the product owner with a one-page summary
- Competitor watch: a hiring spike in a specific function triggers a competitive intelligence note
- Urgent incident: a sentiment crash on your own brand routes immediately to the comms lead
Pro Tip: Name a single monitoring owner. Programmes with shared ownership produce weekly briefs that nobody reads.
What technology stack and team do you actually need?
The architecture has seven layers: ingestion, normalisation, enrichment, scoring engine, alerting, trend repository, and BI integration. For most teams, a starter programme does not need custom infrastructure.
A minimum viable stack uses a combination of off-the-shelf tools for ingestion and alerting, a spreadsheet or Notion database as the trend repository, and Slack as the alerting layer. The scoring engine can be a simple weighted formula in a spreadsheet before you invest in anything more sophisticated. For comparing AI-native vs. augmented insight platforms, the key differentiators are source coverage, cross-source correlation capability, explainability fields, Slack integration, and pricing fit for your team size.
Cross-functional roles and realistic time budgets:
- Monitoring owner: 15 minutes per day, owns triage and escalation
- Analyst: 2–4 hours per week, produces the weekly brief and manages the keyword set
- Product owner or strategist: 30–60 minutes per week, receives the brief and assigns actions
- Engineer or ML maintainer: 2–4 hours per month, monitors model drift and recalibrates scoring
Vendor selection checklist: source coverage breadth, cross-source correlation, explainability on alerts, Slack or BI integration, and a pricing model that does not punish you for scaling signal volume.
How do you prove ROI and keep the system honest?
Start with output metrics: count the number of signals reviewed, the turnaround time from ingestion to brief, and the proportion of alerts that reach a decision-maker. Add quality metrics in the second quarter: actionability score (what percentage of brief items drove a decision?) and signal accuracy rate. Layer in impact metrics by quarter three: decisions influenced, pipeline opportunities surfaced, and time from signal to action.
Detecting a competitive move 90 days before it impacts your market only creates value if your organisation acts on it faster than competitors. Reducing action latency is often more valuable than improving detection speed.
Governance checkpoints keep the system trustworthy over time:
- Monthly model drift check: are scoring thresholds still calibrated to current signal volumes?
- Quarterly bias audit: are sources systematically missing certain languages, geographies, or demographics?
- Transparency fields on every alert: source, score, and reason for escalation
- Lawful public-data collection: confirm that all sources are publicly accessible and that attribution is maintained in the trend repository
Pro Tip: Automate output metric capture from day one. Embed a single question into every weekly brief delivery: "Did this brief inform a decision this week?" One yes/no answer, tracked over time, is your ROI proof.
An Ontherice pilot: the best practices in action
A six-week Ontherice pilot puts the full checklist into practice with minimal setup.
Pilot checklist:
- Week 1: Define 3–5 category keywords; configure Ontherice's signal feeds across 2–3 domains (e.g. finance, technology, products); set scoring thresholds using the platform's multi-AI ranking outputs
- Week 2: Establish the daily triage habit; assign a monitoring owner; connect alerts to Slack
- Weeks 3–4: Run weekly one-page briefs; log actionability scores; identify the first signal that drives a decision
- Week 5: Review model metrics (MSE, perplexity) against brief quality; recalibrate thresholds if false-positive rate exceeds 20%
- Week 6: Measure time from signal to action; present ROI case to stakeholders using output and quality metrics
Example outputs from a pilot in the technology sector: a hiring spike at a competitor surfaces in week two, triggering a competitive intelligence note; an AI query pattern shift in week three informs a content brief; a product review cluster in week four goes to the roadmap owner with three specific feature suggestions.
Ontherice's transparent ranking history lets you validate prediction accuracy before committing to paid Access Points, which is the right way to build internal confidence in a new monitoring programme. The cross-sector trend monitoring benefits become visible quickly once the daily triage habit is established.
What actually separates good monitoring from expensive noise
Most monitoring programmes fail not because the technology is wrong but because the discipline is absent. The teams that get genuine value from market intelligence share three habits: they keep the keyword set ruthlessly small, they name a single owner for daily triage, and they require every alert to carry an explanation of why it scored.
The fanciest model in the world produces nothing useful if nobody reads the weekly brief. Alert fatigue is the most common cause of programme abandonment, and it almost always traces back to one of two failures: too many sources configured before the scoring system is calibrated, or no named owner for the triage step. Fix the ownership problem first. The technology problem is almost always secondary.
Signal versus noise is ultimately a human judgement call. AI surfaces the candidates; a strategist decides which ones connect to a real business decision. The platforms that build in explainability fields and cross-source confirmation make that judgement faster and more defensible. The ones that do not produce dashboards that look impressive and inform nothing.
Cultural adoption matters more than model sophistication. A team that reads a weekly brief, assigns actions, and tracks what happened is running a better monitoring programme than a team with a state-of-the-art pipeline that nobody acts on.
Ontherice gives you a working pilot in six weeks
The gap between "we should monitor the market" and "we have a weekly brief that drives decisions" is usually six weeks and one named owner. Ontherice's AI opportunities feed gives you the signal layer on day one: multi-AI ranking across finance, technology, products, crypto, jobs, and brands, with transparent accuracy tracking so you can see which predictions held.

The free tier covers enough signal volume to establish the daily triage habit and produce your first two weekly briefs. Paid Access Points unlock premium signal cards and deeper cross-sector feeds when you are ready to scale. There is no long-term contract: you top up Access Points as the programme grows. Ontherice's rankings engine surfaces the scoring and velocity data you need to calibrate thresholds without building a custom pipeline. Start your pilot at Ontherice and run the week-one checklist today.
Sources
- Trend Monitoring for Strategy Teams: A Practical Guide
- Market Intelligence KPIs: How to Measure What Matters