

TL;DR:
- Insight triangulation involves combining multiple independent data sources and research methods to validate market insights. It requires at least three sources and a structured analysis approach to ensure reliability, especially in complex decisions. Divergent findings reveal structural insights, not errors, making triangulation a critical risk management tool.
Step by step insight triangulation is the methodical process of combining diverse data sources and research techniques to strengthen the validity and depth of market insights. The standard industry term is methodological triangulation, and it sits at the heart of rigorous market analysis. Single-source findings carry inherent bias. Triangulation corrects that by cross-checking methods, so agreement confirms reliability and divergence signals where deeper investigation is needed. This guide walks analysts and decision-makers through each phase, from framing the right question to applying the four-pillar scoring framework that calibrates confidence before action.
What is step by step insight triangulation and why does it matter?
Insight triangulation is defined as the systematic integration of multiple independent data sources and research methods to produce findings that no single source could validate alone. The process minimises individual method bias and either reinforces a finding's reliability or identifies areas that need further investigation when data diverges. That dual function makes it indispensable for any decision with real commercial stakes.

The method matters because markets generate noisy, contradictory signals every day. A survey might show 57% of customers cite scheduling as a problem, but that number means little until rota data and semi-structured interviews confirm the same pattern. When three independent sources converge, you move from hypothesis to evidence. When they diverge, you have found something worth investigating rather than something to ignore.
Effective triangulation requires deliberate planning: matching question complexity with method complementarity, ensuring independence of data sources, and transparent narrative reporting of the full process. Analysts who skip the planning phase typically end up with overlapping rather than complementary methods, which defeats the purpose entirely.
What prerequisites and tools are essential before triangulating insights?
Preparation determines whether triangulation produces genuine insight or expensive noise. Three conditions must be in place before you begin.
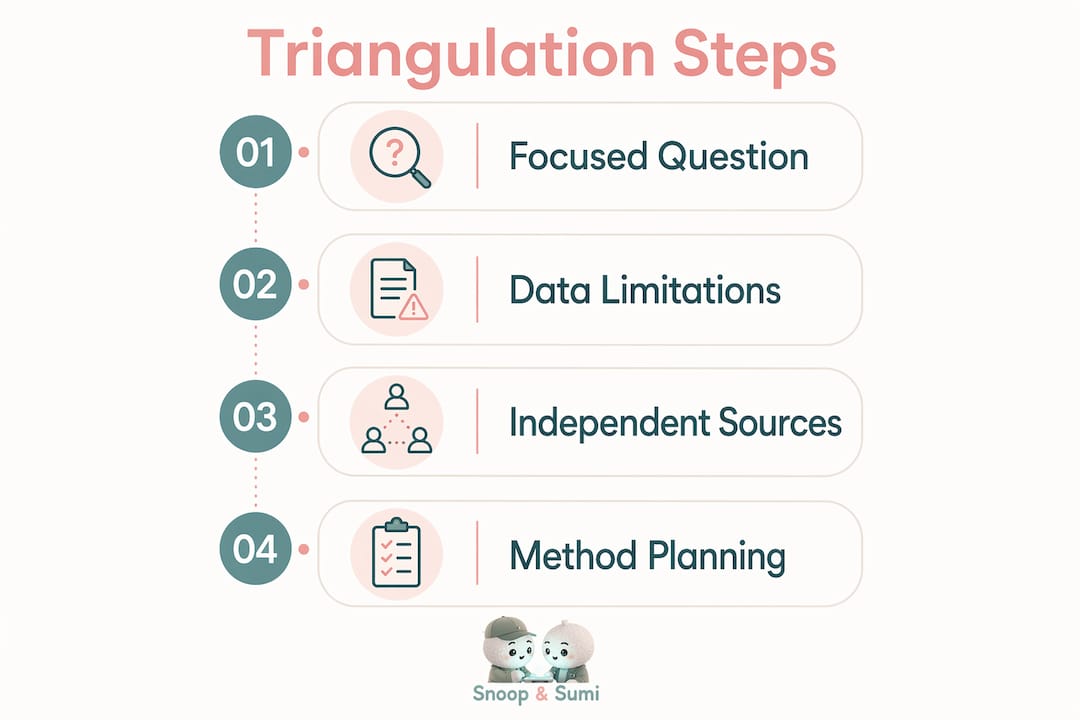
A focused, complex research question. Simple factual queries do not justify triangulation. The method is designed for questions where no single data source can provide a complete answer, such as "Why are mid-market customers churning at a higher rate than enterprise accounts?" That kind of question has structural, behavioural, and perceptual dimensions that require multiple lenses.
A clear map of existing data limitations. Every method has blind spots. Surveys capture stated preferences but miss observed behaviour. Interviews surface nuance but suffer from small samples. Knowing these limitations upfront tells you which complementary methods to select.
Genuinely independent data sources. Independence is non-negotiable. Two datasets drawn from the same customer panel are not independent. Independence means different populations, different collection methods, or different time windows.
The table below outlines the main tool categories analysts use at this stage.
| Tool category | Examples | Best used for |
|---|---|---|
| Quantitative analysis | SPSS, Excel pivot tables | Survey data, sales figures, usage metrics |
| Qualitative coding | NVivo, Atlas.ti | Interview transcripts, open-ended responses |
| Signal detection | AI-driven platforms | Emerging trend identification, real-time data |
| Synthesis frameworks | Convergence matrix | Mapping confirmed vs. dissonant findings |
Recency matters as much as source type. Data older than 18 months in a fast-moving market may introduce more noise than clarity. Check collection dates before committing any dataset to your triangulation plan.
Pro Tip: Plan your methods before collecting any data. If two methods could plausibly share the same respondents or the same underlying dataset, they are not independent and will not strengthen your triangulation.
How to conduct the step by step triangulation process for reliable insights
A standard triangulation process consists of six core steps, each building on the last. Skipping a step does not save time. It creates gaps that undermine the final synthesis.
-
Define a focused research question with a clear rationale. The question must be complex enough to justify multiple methods. Write it down explicitly and confirm it cannot be answered by a single data source before proceeding.
-
Identify the primary method's limitations. If your anchor method is a quantitative survey, list what it cannot tell you: motivations, context, edge cases. These gaps define what your secondary and tertiary methods must cover.
-
Select genuinely complementary methods. A survey paired with semi-structured interviews covers both breadth and depth. Adding 18 months of exit data introduces a longitudinal dimension. Each method must address a gap the others leave open.
-
Apply methodological rigour to every source. A weak method dilutes the entire triangulation. If your interview sample is too small to be representative, or your secondary dataset has known collection errors, address those issues before integrating findings.
-
Analyse convergence and divergence systematically. Build a convergence matrix: list each finding from each method and mark it as confirmed, complementary, or dissonant. Confirmed findings appear across all sources. Complementary findings add context. Dissonant findings demand explanation.
-
Integrate findings into a coherent interpretation. Write a narrative that explains what the convergent evidence shows, what the complementary evidence adds, and what the dissonant findings reveal about underlying complexity.
The table below compares the two main approach categories analysts choose between.
| Approach category | Strengths | Limitations |
|---|---|---|
| Quantitative + qualitative | Breadth and depth combined | Requires skilled integration |
| Multi-source quantitative | Consistent data format | Misses behavioural nuance |
Pro Tip: When building your convergence matrix, treat dissonant findings as the most valuable column. Contradictions often reveal structural issues that convergent data masks entirely.
A practical example makes this concrete. A 300-person survey combined with 20 semi-structured interviews and 18 months of exit data showed 57% cited scheduling as an issue, confirmed by rota data. The interviews then explained why scheduling was the issue, and the exit data showed when it became critical in the customer lifecycle. Three methods, three dimensions, one coherent finding.
How to assess and validate the quality of triangulated insights
Not all triangulated findings carry equal weight. The four-pillar scoring framework rates insight quality across four dimensions, each scored on a 5–15 point scale.
- Number of sources. A finding confirmed by three or more independent sources scores highest. Two sources remain a hypothesis.
- Data diversity. Qualitative and quantitative sources together score higher than two sources of the same type.
- Recency. Data collected within the past 12 months scores higher than older material in dynamic markets.
- Rigour. Methods with documented protocols, adequate sample sizes, and clear collection standards score higher than ad hoc data pulls.
The four-pillar framework plugs directly into prioritisation models such as RICE, giving decision-makers a structured way to weigh confidence against effort and impact. That connection transforms triangulation from a research exercise into a risk management tool.
The three-touch validation rule sets the minimum bar for actionable intelligence.
A two-point convergence is a hypothesis. A third independent source is what converts an observation into actionable business intelligence. The three-touch rule is the gold standard for validation.
Two sources agreeing is encouraging. It is not sufficient. Three-source validation is the threshold at which a finding earns the right to drive a business decision. Analysts who act on two-source findings are accepting hypothesis-level risk, which is sometimes necessary under time pressure but should be a conscious choice, not an oversight.
Divergence in your findings is not a failure. It is a signal. When sources disagree, the disagreement itself tells you something about the complexity of the phenomenon you are studying. Map it explicitly rather than averaging it away. You can find real-time trend validation examples that illustrate how divergence surfaces early-stage signals before they consolidate into mainstream patterns.
Common challenges and mistakes in insight triangulation
The most common mistake in triangulation is using it to confirm a pre-existing belief rather than to test one. Practitioners often err by selecting methods that are likely to agree with their anchor finding, which produces the appearance of validation without the substance.
The second most common error is integrating summary reports instead of raw data. Summary reports strip out the participant-level context needed for traceability. Mapping quotes and participant identifiers across studies prevents misinterpretation and supports auditability. If you cannot trace a finding back to a specific data point, your synthesis is not auditable.
Three further pitfalls are worth naming directly.
- Weak methods diluting strong ones. Including a poorly designed survey alongside rigorous interview data does not add weight. It introduces noise. Every method in your triangulation must meet the same rigour standard.
- Treating convergence as the end goal. Convergence confirms. Divergence informs. Analysts who stop at convergence miss the structural insights that only dissonant data reveals.
- Ignoring timing mismatches. Data collected 24 months apart in a volatile market may not be measuring the same phenomenon. Always check whether your sources are temporally comparable.
Cross-study synthesis moves beyond summary when it surfaces contradictions with cited evidence. Techniques include simultaneous raw-data access, contradiction detection, and longitudinal comparisons.
Pro Tip: Use AI-assisted synthesis tools to connect findings across studies at the raw-data level. Platforms that surface contradictions automatically reduce the risk of confirmation bias in your convergence matrix. Ontherice applies exactly this kind of multi-source signal analysis to market trend data.
Key takeaways
Effective insight triangulation requires at least three independent sources, a structured convergence matrix, and a four-pillar quality score before any finding earns the right to drive a business decision.
| Point | Details |
|---|---|
| Define before you collect | Write a focused, complex research question before selecting any methods or datasets. |
| Independence is non-negotiable | Data sources must differ in population, method, or time window to provide genuine triangulation. |
| Three-touch validation rule | Two converging sources form a hypothesis; a third independent source creates actionable evidence. |
| Four-pillar scoring | Rate every insight on sources, diversity, recency, and rigour before connecting findings to decisions. |
| Divergence is data | Dissonant findings reveal structural complexity. Map them explicitly rather than resolving them away. |
Why I think most analysts are doing triangulation backwards
Most triangulation guides tell you to start with your methods and then see what converges. That is the wrong order. The question must come first, and it must be genuinely complex. If you can answer it with one dataset, you do not need triangulation. You need better data.
What I have seen repeatedly in practice is analysts selecting three methods that all measure the same thing from slightly different angles, then calling it triangulation. A customer satisfaction survey, a Net Promoter Score poll, and a post-purchase rating form are not three independent methods. They are one method repeated three times. The four-pillar scoring framework exposes this immediately because data diversity scores near zero.
The insight triangulation process becomes genuinely powerful when you pair a quantitative dataset with qualitative depth and then add a longitudinal or behavioural source. That combination covers stated preferences, lived experience, and actual behaviour. No single dimension can fake the other two.
The time pressure argument is real. Triangulation done properly takes longer than a single-source analysis. But the four-pillar framework gives you a structured way to accept risk consciously when you cannot reach the three-touch threshold. You know exactly which confidence dimension you are compromising, and you can communicate that to stakeholders clearly. That transparency is worth more than a false sense of certainty from a rushed single-source report.
— Aidil
How Ontherice supports your triangulation and market analysis
Ontherice is built for analysts who need to move from raw signals to validated insights without losing traceability. The platform scans global data points across multiple markets, applies AI-driven scoring to surface what is gaining momentum, and produces ranked outputs that feed directly into your triangulation workflow.

For professionals working on cross-market validation, the SignalsInternational tool aggregates signals across sectors and geographies, giving you the independent, diverse data sources that triangulation demands. Rather than assembling datasets manually from disparate sources, you get a structured feed of scored, ranked signals ready for convergence analysis. Ontherice makes the data-gathering phase faster without sacrificing the methodological independence that makes triangulation credible.
FAQ
What is insight triangulation in market analysis?
Insight triangulation is the process of combining multiple independent data sources and research methods to validate a finding. Agreement across sources confirms reliability; disagreement signals areas needing deeper investigation.
How many sources does triangulation require?
A minimum of three independent sources is required for actionable evidence. Two-source convergence remains a hypothesis until a third independent confirmation is added.
What is the four-pillar scoring framework?
The four-pillar framework rates insight quality by number of sources, data diversity, recency, and rigour, each on a 5–15 point scale. The combined score calibrates confidence and feeds into prioritisation models such as RICE.
What is a convergence matrix?
A convergence matrix is a structured table that maps each finding from each method as confirmed, complementary, or dissonant. It makes divergence visible and prevents analysts from averaging away contradictions that carry real information.
How does step by step data triangulation differ from simple multi-source research?
Multi-source research collects data from several places. Step by step data triangulation requires those sources to be genuinely independent, methodologically rigorous, and systematically compared through convergence analysis rather than simply aggregated.