
TL;DR:
- Data exploration is a structured, iterative process that uncovers meaningful patterns and insights. Following a six-step lifecycle improves efficiency and reduces rework by 30–40 percent. Validating anomalies with domain experts and automating workflows ensures reliable, scalable data analysis.
Data exploration is the structured, iterative process of analysing datasets using statistical and visual methods to uncover patterns, anomalies, and insights that drive informed decisions. Knowing how to design data exploration processes separates analysts who generate reliable insights from those who produce noise. The industry standard for this work is the 6-step exploration lifecycle: Data Discovery, Profiling, Visual Pattern Recognition, Domain Validation, Documentation, and Readiness Assessment. Teams that follow this structured approach report a 30–40% reduction in rework time. That figure alone justifies building a repeatable framework before touching a single dataset.
How to design data exploration processes: essential components
Every effective exploration workflow starts with a clear inventory. Before writing a single query, you need to know what data sources exist, what metadata is available, and which business question you are trying to answer. Skipping this step is the single most common reason exploration projects drift into scope creep.
The tools you select at this stage shape everything downstream. The core categories are:
- Statistical software: Python (pandas, scipy), R, or SQL for profiling and hypothesis testing
- Visualisation platforms: Tableau, Power BI, or open-source libraries like Matplotlib and Seaborn
- Automated data profilers: Tools that generate summary statistics, null counts, and distribution shapes in one pass
- Metadata catalogues: Systems that document data lineage, ownership, and update frequency
Pro Tip: Run an automated profiler on every new dataset before writing any analytical code. It surfaces null rates, cardinality issues, and outliers in minutes rather than hours.
Defining success metrics at the planning stage is not optional. Establishing KPIs early underpins reliable, compliant analytics and gives your exploration a measurable target. Without a defined "north star" business question, analysts tend to explore indefinitely. Spending 20–30% of initial project time on defining business requirements measurably improves overall project efficiency. That investment pays back in focused, faster analysis.

Early-stage profiling techniques include computing descriptive statistics (mean, median, standard deviation), checking for missing values, and identifying data type mismatches. These steps reveal whether the dataset is fit for the question at hand before any modelling begins.
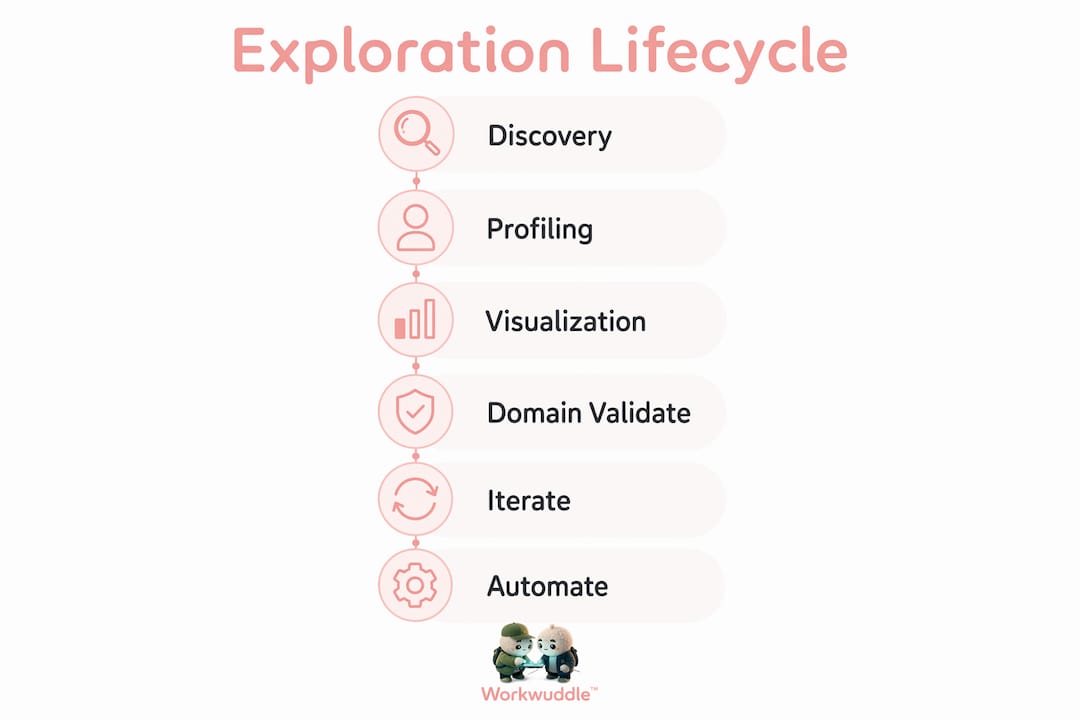
What are the steps to implement a data exploration lifecycle?
The 6-step lifecycle gives analysts a repeatable structure. Each phase has a specific output that feeds the next.
- Data discovery. Identify all relevant data sources, confirm access rights, and document schema and update cadence. The output is a verified data inventory.
- Profiling and summarisation. Compute summary statistics, check distributions, and flag data quality issues. Profiling should happen within the first 10–20% of project duration to avoid wasted effort downstream.
- Visual and pattern recognition. Apply univariate analysis (histograms, boxplots) and bivariate analysis (scatterplots, correlation matrices). Correlation coefficients range from -1 to 1, with values near the extremes indicating strong linear relationships worth investigating.
- Domain validation. Share findings with subject matter experts before drawing conclusions. Anomalies flagged during exploration reflect actual business process changes in over 50% of cases rather than data errors. Domain review prevents misinterpretation that wastes modelling effort.
- Documentation and issue tracking. Record every data quality issue, assumption, and transformation decision. This log becomes the audit trail for any model or report built on top of the exploration.
- Readiness assessment. Evaluate whether the data is sufficient to answer the business question. If not, loop back to discovery with a refined scope.
Pro Tip: Treat the lifecycle as a loop, not a line. Integrating machine learning models early often reveals patterns that send you back to the profiling phase with better hypotheses.
The iterative nature of this process is its greatest strength. Exploration results frequently prompt a return to earlier data preparation phases for refinement. Building that loop into your workflow from the start prevents the frustration of discovering a critical data gap at the modelling stage.
| Phase | Primary technique | Output |
|---|---|---|
| Discovery | Schema review, access audit | Verified data inventory |
| Profiling | Descriptive statistics, null analysis | Quality report |
| Visual analysis | Histograms, scatterplots | Pattern and anomaly log |
| Domain validation | Expert review sessions | Validated interpretation |
| Documentation | Issue log, transformation notes | Audit trail |
| Readiness assessment | Gap analysis | Go / no-go decision |
How to overcome common pitfalls in data exploration?
The most damaging mistake in data exploration is over-cleaning before testing hypotheses. Analysts spend weeks engineering perfect datasets only to discover the data cannot answer the original question. Lightweight exploratory models tested early save weeks of unnecessary data engineering. Run a quick logistic regression or a simple decision tree first. If the signal is not there, refine the question before refining the data.
Scope creep is the second major risk. Without a clearly defined business question, every new pattern becomes a new sub-project. The discipline of returning to your "north star" question at the start of each session keeps exploration productive rather than endless.
Common pitfalls to avoid:
- Skipping domain validation. Treating every anomaly as a data bug rather than a potential business signal leads to incorrect conclusions. Over half of anomalies represent real process changes, not technical errors.
- Ignoring metadata. Exploring data without understanding its lineage or update frequency produces insights that may already be stale.
- Treating exploration as a one-time event. Data changes. Workflows that do not account for refreshed data become unreliable quickly.
- Documenting nothing. Undocumented exploration is irreproducible. A future analyst, or your future self, cannot build on work that was never recorded.
"The goal of data exploration is not to find every pattern. It is to find the patterns that matter to the business question at hand."
Iterative exploration cycles that incorporate emerging insights are more productive than exhaustive single-pass analyses. Each loop should produce a testable hypothesis, not just more charts.
How to integrate data exploration with analytics workflows?
Data exploration does not exist in isolation. It sits inside the Analytics Development Lifecycle (ADLC), an 8-stage cyclical process: Plan, Develop, Test, Deploy, Operate, Observe, Discover, and Analyse. Each stage feeds the next, and exploration outputs from the Discover and Analyse stages directly inform the Plan stage of the next cycle. This structure keeps workflows aligned with business goals rather than drifting into academic analysis.
Embedding exploration outputs into operational systems is where most organisations underinvest. Write-back capabilities integrated into analytical workflows increase adoption of exploration insights by 40–60%. When analysts can act on findings directly within a CRM or ERP system, insights stop living in dashboards and start driving decisions. That shift from passive reporting to active decision support is the difference between analytics that gets read and analytics that gets used.
Key practices for operational integration:
- Automate data refreshes. Automated refreshes cut human error by over 50% and turn one-off analyses into repeatable assets.
- Standardise output formats. Exploration outputs should follow a consistent structure so downstream teams can consume them without translation.
- Define success metrics upfront. Establishing KPIs at the planning stage leads to measurable ROI in the majority of analytics initiatives.
- Govern your data. Strong governance frameworks maintain accuracy, security, and trustworthiness across every exploration cycle.
Pro Tip: Link your exploration workflow to a living documentation system. When the data changes, the documentation updates automatically, keeping your audit trail current.
| Integration practice | Business benefit |
|---|---|
| Automated data refreshes | Reduces human error, enables continuous insight |
| Write-back to operational systems | Increases adoption of findings by 40–60% |
| Standardised output formats | Speeds up downstream consumption |
| Upfront KPI definition | Creates measurable ROI benchmarks |
| Data governance framework | Maintains accuracy and compliance |
Key takeaways
Effective data exploration requires a structured lifecycle, domain validation at every anomaly, and automation to make workflows repeatable and reliable.
| Point | Details |
|---|---|
| Follow the 6-step lifecycle | Move through Discovery, Profiling, Visualisation, Domain Validation, Documentation, and Readiness Assessment in sequence. |
| Define the business question first | Spending 20–30% of initial time on requirements prevents scope creep and accelerates insight generation. |
| Validate anomalies with domain experts | Over half of flagged anomalies reflect real business changes, not data errors. |
| Automate for repeatability | Automated data refreshes cut human error by over 50% and turn exploration into a scalable asset. |
| Embed outputs into operations | Write-back capabilities increase adoption of exploration insights by 40–60%. |
Why I think most data exploration fails before it starts
The most common failure I see is not technical. Analysts arrive at a dataset with sophisticated tools and no clear question. They produce beautiful visualisations of things nobody asked about. The exploration looks thorough. The business impact is zero.
The fix is uncomfortable because it requires slowing down before speeding up. Spending real time with stakeholders to define a precise business question feels inefficient when you are eager to get into the data. It is the opposite of inefficient. Every hour spent sharpening the question saves three hours of misdirected analysis.
I have also seen teams treat domain expert sessions as a formality rather than a genuine checkpoint. They share findings, collect nods, and move on. The real value of domain validation comes from asking experts to challenge your interpretation, not confirm it. When an expert says "that spike in october is because we changed our billing system," that single sentence changes the entire direction of the analysis.
The other thing I would push back on is the obsession with clean data before exploration. Cleaning before you know what matters is backwards. Run a lightweight exploratory model on messy data first. If the signal survives the noise, it is worth cleaning for. If it does not, you have saved yourself a week of engineering work on a dead end.
Speed and polish are not opposites in exploration. The fastest explorers I know produce rough, well-documented work that others can build on. The slowest produce polished work that answers the wrong question.
— Aidil
Ontherice and your data exploration workflows
Ontherice uses multiple AI engines to scan global data points, extract meaningful signals, and surface emerging trends before they reach mainstream awareness. That same signal-extraction logic applies directly to data exploration workflows where spotting patterns early is the entire point.

Analysts and BI professionals who want to move faster from raw data to reliable insight can use Ontherice's AI-driven tools to identify which signals in their datasets are gaining momentum. The platform's AI opportunities engine helps teams prioritise which data threads are worth pursuing, cutting the time spent on low-signal exploration. Ontherice brings the same structured, repeatable approach to market intelligence that this guide recommends for internal analytics.
FAQ
What is the standard framework for data exploration?
The standard framework is a 6-step lifecycle covering Data Discovery, Profiling, Visual Pattern Recognition, Domain Validation, Documentation, and Readiness Assessment. Teams using this structure report a 30–40% reduction in rework time.
When should data profiling happen in a project?
Profiling should occur within the first 10–20% of project duration. Starting early surfaces data quality issues before they affect downstream modelling or analysis.
How do you prevent scope creep during data exploration?
Define a clear business question before touching the data. Spending 20–30% of initial time on requirements definition measurably reduces scope drift and accelerates the path to insight.
Why is domain expert validation necessary in data exploration?
Domain experts catch misinterpretations that statistical methods cannot. Over half of anomalies flagged during exploration reflect real business process changes rather than data errors, making expert review a critical checkpoint.
How does automation improve data exploration workflows?
Automated data refreshes reduce human error by over 50% and convert one-off analyses into repeatable, scalable assets that support continuous decision-making.