

A rigorous emerging sector analysis produces three concrete outputs: a ranked shortlist of candidate sectors, a validation plan with evidence requirements for each, and a set of monitoring triggers that tell you when to act or exit. The methodology below takes you from a blank page to a defensible investment or strategic thesis in roughly four to six weeks for a first pass.
Ordered checklist:
- Define scope: set geographic boundaries, NAICS classification codes, and a time horizon
- Gather data: pull government statistics, trade publications, patent filings, and funding databases
- Screen candidates: score sectors against quantitative signals (growth rate, patent activity, hiring velocity)
- Analyse structure and drivers: apply Porter's Five Forces, PESTEL, and TAM/SAM/SOM
- Validate: run expert interviews, supplier checks, and lightweight market tests
- Prioritise and monitor: rank by strategic fit and set dashboard triggers for ongoing review
Timeline callout: Quick scan (steps 1–3): one to two weeks. Deep-dive analysis (steps 4–5): two to three weeks. Thesis memo and monitoring setup (step 6): one week.
Key takeaways
A defensible emerging sector thesis requires signal convergence across at least three independent indicators, framework-based structural analysis, and practitioner validation before any resource commitment.
| Point | Details |
|---|---|
| Start with NAICS scope | Define sector boundaries using NAICS codes before gathering any data to avoid scope drift. |
| Require signal convergence | Advance a sector to deep-dive only when hiring, patents, and funding all accelerate within the same 12-month window. |
| Apply frameworks in sequence | Run PESTEL first for macro context, then Porter for competitive structure, then TAM for size validation. |
| Validate with sceptics | Seek out practitioners who disagree with your thesis; unresolved objections mean the thesis is not ready. |
| Ontherice for screening | Use Ontherice's AI Opportunities feed to generate a pre-ranked sector shortlist and compress the screening phase. |
Table of Contents
- What does a step-by-step emerging sector analysis actually involve?
- How to run each phase: outputs, templates, and question prompts
- Where do you find reliable data for sector research?
- Which analytical frameworks should you apply, and when?
- What metrics and signals indicate a sector is genuinely emerging?
- How do you validate signals and build a prioritised investment thesis?
- How does an AI signal platform fit into this playbook?
- Sector analysis in practice: two illustrative applications
- What the checklist misses in practice
- Ontherice accelerates the screening and monitoring phases
- Sources
What does a step-by-step emerging sector analysis actually involve?
Sector analysis, as Investopedia defines it, is the process of evaluating the economic and financial prospects of a specific industry segment, typically using top-down screening or sector-rotation approaches that align sector selection with the business-cycle stage. The term "emerging sector analysis" extends that framework to sectors that are not yet mainstream: they show accelerating signals but have not yet attracted consensus coverage or institutional capital at scale.
The distinction matters because the analytical toolkit shifts. Established sectors have deep historical data, analyst coverage, and liquid benchmarks. Emerging ones require you to weight leading indicators more heavily: patent filings, job-posting velocity, early-stage funding rounds, and search-interest trends. You are reading the smoke before the fire is visible.
Ashmore's 2026 emerging markets outlook makes the point plainly: broad sector bets are losing ground to active management and micro-driver tracking, because geopolitical uncertainty and structural shifts like AI capital expenditure create divergent outcomes within what look like homogeneous sectors. A stepwise industry evaluation that drills to sub-sector level is no longer optional.
How to run each phase: outputs, templates, and question prompts
The six phases below map directly to the opening checklist. Each phase has a named deliverable, a suggested owner, and a realistic time estimate for a two-person analyst team.
| Phase | Deliverable | Owner | Time estimate |
|---|---|---|---|
| 1. Define scope | Scope memo (one page: NAICS codes, geography, time horizon) | Lead analyst | 1–2 days |
| 2. Gather data | Source log (spreadsheet: source, date, signal type, URL) | Research associate | 3–5 days |
| 3. Screen candidates | Sector scorecard (ranked table of 8–12 candidates) | Lead analyst | 3–4 days |
| 4. Analyse structure and drivers | Framework summary (Porter + PESTEL + TAM one-pager per sector) | Lead analyst | 5–7 days |
| 5. Validate | Interview and pilot summary (evidence table, 3–5 sources per sector) | Both | 5–7 days |
| 6. Prioritise and monitor | Thesis memo + dashboard with triggers | Lead analyst | 2–3 days |
Question prompts by phase:
Scope: Which NAICS codes capture this sector without bleeding into adjacent ones? What is the realistic addressable geography for entry in the next 24 months?
Data gathering: Where is the earliest signal appearing — in patents, job postings, or funding rounds? Which trade associations publish primary data for this sector?
Screening: Does the sector show at least two independent accelerating signals? Is the growth rate outpacing the broader market on a trailing 12-month basis?
Structure and drivers: Who captures the most margin in the value chain today, and is that position defensible? What macro force is the primary demand driver?
Validation: Do practitioners confirm the demand signal, or is it purely financial? Can a lightweight pilot test the core assumption within 60 days?
Prioritise and monitor: What single metric, if it reverses, would invalidate the thesis? Who owns the weekly monitoring task?
One-line template examples:
- Scope memo opener: "This analysis covers NAICS [code], US market, 2024–2028 horizon, focusing on sub-segments showing >15% year-on-year revenue growth."
- Thesis memo opener: "[Sector X] is entering a structural growth phase driven by [primary driver]; the addressable market is [TAM estimate]; the primary risk is [named risk]."
Pro Tip: Use the CurvedTrading 8-step framework as a signal-hygiene reference alongside this playbook. Its emphasis on relative strength, volume confirmation, and leader identification maps directly to the screening phase and reduces false positives from momentum-only signals.
Where do you find reliable data for sector research?
The SBA's market research and competitive analysis guide recommends a structured split between primary data (interviews, surveys, pilots) and secondary data (published reports, government statistics, databases). For emerging sector work, secondary data dominates the early phases; primary data becomes critical at validation.
Classification systems
Start with NAICS (North American Industry Classification System) to set hard boundaries. Every US government dataset — Census Bureau, Bureau of Labor Statistics, Bureau of Economic Analysis — is indexed by NAICS code. SIC codes remain useful for older datasets and some financial databases. Look up codes at census.gov/naics; a six-digit code gives you the tightest sub-sector definition.
Free authoritative sources
- IFC Emerging Market Insights (Ifc): sector and country notes that illustrate how structural drivers and policy responses shape sector-level outcomes
Paid and commercial sources
Paid databases earn their cost when you need standardised financials across private companies, proprietary survey data, or pre-built sector models. The most commonly used are PitchBook (funding rounds, valuations, M&A), Bloomberg Terminal (macro and equity data), IBISWorld (pre-built US industry reports), and Statista (aggregated survey and market-size data).
Free sources cover the basics for screening. Paid data becomes necessary at the deep-dive phase when you need private-company financials, standardised cross-sector comparisons, or real-time deal flow.
Search tactics
Boolean queries in Google News: "[sector keyword]" AND ("funding round" OR "Series B" OR "IPO") site:techcrunch.com OR site:reuters.com
Patent acceleration query in Google Patents: search by CPC class, filter "filed after 2022," sort by filing date, and watch for a cluster of assignees you do not recognise — new entrants filing patents is a strong early signal.
Which analytical frameworks should you apply, and when?
Each framework answers a different question. Using all of them on every candidate is inefficient; the table below maps each to its primary question and the scorecard input it produces.
| Framework | Primary question answered | Sample KPI inputs |
|---|---|---|
| Porter's Five Forces | How attractive is the competitive structure? | Supplier concentration ratio, buyer switching cost, entry barrier score |
| PESTEL | Which macro forces are driving or blocking growth? | Regulatory pipeline score, technology readiness level, demographic demand index |
| TAM/SAM/SOM | How large is the opportunity, and what is realistically capturable? | Total addressable market ($), serviceable addressable market ($), share assumption (%) |
| Value-chain mapping | Where does margin sit, and who controls it? | Gross margin by tier, capex intensity by node, integration risk score |
| Scenario analysis | What happens under different macro assumptions? | Revenue range under base/bull/bear, probability-weighted NPV |
Babson's industry analysis guide positions Porter's Five Forces as the anchor framework for competitive structure, with the five forces (supplier power, buyer power, threat of substitutes, threat of new entrants, and rivalry intensity) each producing a qualitative rating that feeds directly into a scorecard.
PESTEL sits upstream of Porter: it identifies the macro forces that are reshaping the five forces themselves. A regulatory change (the P and L in PESTEL) can collapse an entry barrier overnight; a technology shift (the T) can render substitutes suddenly viable. Run PESTEL first to set context, then Porter to assess current structure.
TAM/SAM/SOM is the sanity check. A sector can look structurally attractive and macro-tailwind-supported but still be too small or too fragmented to justify entry. Build TAM from the bottom up using NAICS revenue data from the Census Bureau, then apply realistic penetration assumptions to arrive at SOM.
One-page output example (Porter summary sentence): "Supplier power is HIGH due to three dominant raw-material producers; buyer power is MODERATE with fragmented end-customers; new-entrant threat is LOW given $200M+ minimum capex requirements; substitutes are EMERGING in the 3–5 year window; rivalry is MODERATE but intensifying."
Scenario analysis belongs at the validation phase, not the screening phase. Build three scenarios (base, bull, bear) around the single most uncertain macro variable for that sector — typically regulatory approval timing, commodity price, or technology adoption rate.
What metrics and signals indicate a sector is genuinely emerging?
The risk in emerging sector work is confusing noise for signal. A sector trending on social media is not the same as a sector with accelerating capital commitment and hiring. The table below lists the indicators that carry the most weight, with practical sources and suggested action thresholds.
| Indicator | Data source | Time window | Action threshold example |
|---|---|---|---|
| Revenue CAGR | Census Bureau, IBISWorld | 3-year trailing | >15% CAGR vs. <5% for broader market |
| Job posting velocity | BLS, LinkedIn, Indeed | 6-month trailing | Accelerating increase in sector-specific roles |
| Patent filing count | USPTO, Google Patents | 2-year trailing | >30% increase in filings; new assignees entering |
| VC/PE funding rounds | PitchBook, Crunchbase | 12-month trailing | Series A/B rounds doubling year-on-year |
| Capex growth | SEC 10-K filings, BEA | 2-year trailing | Major incumbents increasing sector capex sharply |
| Search interest trend | Google Trends | 12-month trailing | Sustained upward trend, not a single spike |
| ETF inflows | ETF.com, Bloomberg | 6-month trailing | Net inflows accelerating for thematic ETFs |
| M&A activity | PitchBook, SEC EDGAR | 12-month trailing | Acquisition multiples rising; strategic buyers entering |
Lazard's mid-year 2026 outlook highlights AI capital expenditure and semiconductor supply-chain reconfiguration as structural drivers producing divergence across markets and sectors. That divergence is exactly what these indicators are designed to detect: not that a broad technology sector is growing, but that specific sub-sectors within it are pulling away from the rest.
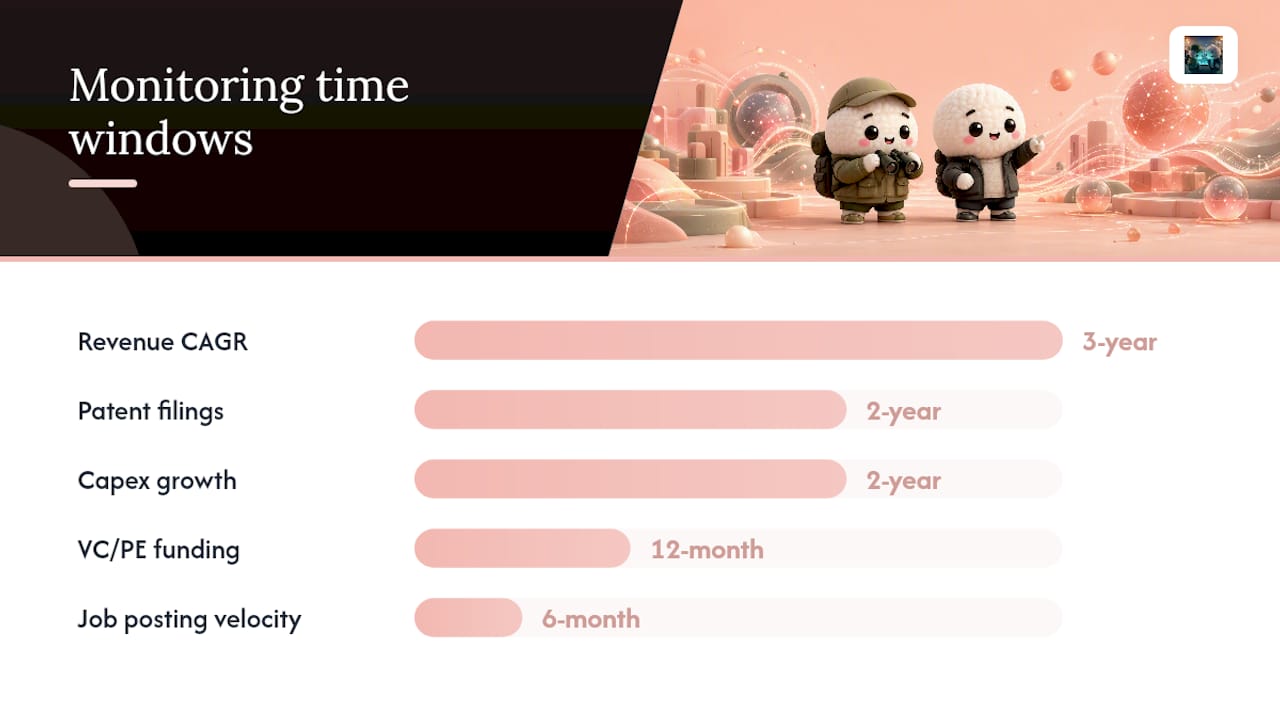
Leading signals to watch first: Accelerating hiring in specialised roles (e.g. "process engineer" or "regulatory affairs specialist" in a specific sub-sector) tends to lead revenue growth by two to four quarters. Concentrated capex from one or two incumbents signals that insiders believe the market is real. Rising patent activity from new assignees — not just incumbents defending territory — indicates genuine competitive entry.
Pro Tip: Never act on a single indicator. The most reliable early signal is convergence: when job postings, patent filings, and funding rounds all accelerate within the same 12-month window, the probability of a genuine emerging sector rises sharply. Two signals moving together is interesting; three is a thesis.
Signal convergence note: A sector showing simultaneous acceleration in hiring, patents, and early-stage funding across a 12-month window has historically been a stronger predictor of sustained growth than any single metric in isolation. Track at least three independent indicators before advancing a candidate to the deep-dive phase.
How do you validate signals and build a prioritised investment thesis?
Validation is where most analysts cut corners, and it is the phase most likely to save you from an expensive mistake. The goal is to stress-test the quantitative signals against real-world evidence before committing resources.
Validation tactics
- Expert interviews: Target practitioners two levels deep in the value chain — not just executives, but engineers, procurement managers, and distributors. Ask what is changing in their day-to-day work, not what they think the market will do.
- Supplier checks: Contact upstream suppliers and ask about order-book changes, lead times, and new customer inquiries. Suppliers see demand shifts before they appear in public financials.
- Customer pilots: For strategic entry decisions, a lightweight pilot (a small contract, a proof-of-concept, a limited product test) converts a hypothesis into evidence within 60–90 days.
- Triangulate data streams: Cross-reference your quantitative signals against at least two independent qualitative sources. If job-posting data says hiring is accelerating but every practitioner interview describes a hiring freeze, trust the interviews.
- Governance checklist: Before advancing to a thesis memo, confirm: (a) at least three independent signals converge, (b) at least two practitioner interviews support the demand narrative, (c) a named risk owner is assigned for each key risk, and (d) a monitoring trigger is defined.
Prioritisation matrix
A sector scorecard approach that weights valuation, earnings revisions, growth, macro alignment, and momentum helps rank sectors objectively. For strategic (non-investment) decisions, replace valuation and earnings with strategic fit and execution capability.
Thesis memo template:
"[Sector X] is entering a structural growth phase driven by [primary driver]. The addressable market is [TAM], growing at [CAGR]. Three converging signals support this view: [signal 1], [signal 2], [signal 3]. The primary risk is [named risk], monitored via [trigger metric]. The recommended action is [entry/monitor/exit] with a review gate at [date or milestone]."
Move from shortlist to pilot in 30–60 days. Set a hard review gate: if the pilot does not confirm the demand signal within the agreed window, the thesis is paused, not extended indefinitely.
How does an AI signal platform fit into this playbook?
An AI signal pipeline compresses the most time-intensive parts of the methodology: data ingestion, normalisation, and initial screening. The pipeline works in five stages: raw data ingestion from public and licensed sources, normalisation into a common schema, feature extraction (isolating the indicators from the metrics table above), anomaly detection (flagging acceleration or deceleration against a baseline), and ranked output delivered to the analyst.

The integration points with the earlier checklist are specific:
| Checklist phase | Where AI output slots in | Human check required |
|---|---|---|
| Screen candidates | AI-ranked shortlist of 8–12 sectors by signal convergence | Analyst reviews for classification errors and scope alignment |
| Analyse structure | AI-surfaced news clusters, patent assignee lists, funding summaries | Analyst applies Porter and PESTEL frameworks manually |
| Validate | AI flags contradictory signals or data gaps | Analyst conducts interviews and pilots |
| Monitor | AI sends trigger alerts when a monitored metric crosses threshold | Analyst decides whether to act, escalate, or hold |
Illustrative workflow example: A two-person team running a quarterly sector scan used to spend roughly three days on data gathering and initial screening. With an AI signal platform handling ingestion and first-pass ranking, that phase compresses to a half-day review of the ranked output, freeing the remaining time for framework analysis and validation — the steps where human judgement is irreplaceable.
Ashmore's 2026 outlook reinforces this: micro-driver tracking and country/sector differentiation require more analytical bandwidth, not less. AI handles the volume; the analyst handles the nuance.
Common failure modes and human checks:
- Recency bias in training data: AI models trained on recent data may over-weight fast-moving signals and miss slow-building structural shifts. Counter by always checking a 3–5 year trend alongside the 12-month signal.
- Classification drift: NAICS codes do not always keep pace with new business models. An AI platform may misclassify a sub-sector. Always verify the NAICS scope manually before acting on a ranked output.
- Correlation without causation: A spike in search interest and a spike in funding rounds may be driven by the same media event, not independent demand signals. Require at least one operational indicator (hiring, capex, or patents) to confirm.
For a practical guide to trend opportunity scanning that maps directly to these integration points, the Ontherice blog covers automation routines and monitoring setup in detail.
Sector analysis in practice: two illustrative applications
Precision fermentation (food technology)
A strategy team at a mid-sized food ingredients company ran this methodology in 2024 to assess precision fermentation as a potential entry point. In the scope phase, they used NAICS 311999 (all other food manufacturing) and 325414 (biological product manufacturing) to set boundaries.
Porter's Five Forces analysis revealed low buyer power (food manufacturers were actively seeking supply alternatives), moderate supplier power (fermentation equipment is concentrated but not monopolised), and a high threat of new entrants given falling bioreactor costs. PESTEL flagged regulatory approval timelines (FDA Novel Food pathway) as the primary constraint. TAM modelling, using BEA food sector output data, put the addressable sub-segment at roughly $8B by 2030 under a base-case adoption scenario.
Validation interviews with three procurement managers at major food brands confirmed active supplier qualification programmes already underway. The thesis memo concluded: early-growth phase, 18-month entry window before incumbents consolidate supply agreements. The monitoring trigger set was: FDA Novel Food approvals per quarter and capex announcements from the two largest incumbent ingredient companies.
Residential energy storage
A second example: an investment analyst team assessed residential battery storage in 2023 using the same six-phase structure. Screening signals were unambiguous: BLS data showed electrician and battery-systems installer job postings up sharply, Google Trends showed sustained multi-year growth in "home battery" searches, and SEC 10-K filings from utility companies showed rising capex commentary on distributed energy resources.
The PESTEL scan identified the Inflation Reduction Act tax credits as the primary policy tailwind, with grid-reliability concerns as a secondary demand driver. Porter's analysis flagged high rivalry (multiple well-capitalised entrants) but also high switching costs for installed systems, creating a durable customer relationship once acquired. The prioritisation matrix scored this sector highly on market size and timing, but lower on ease of entry due to installer-network requirements. The thesis: invest in the installer-network layer, not the hardware layer, where margin was compressing fastest.
Both examples follow the same structure: NAICS-bounded scope, multi-signal screening, framework analysis, practitioner validation, and a thesis with named monitoring triggers. The IFC's Emerging Market Insights series provides comparable structural analysis for international sector assessments, particularly useful when extending either example to non-US markets.
What the checklist misses in practice
The methodology above is sound. What it cannot fully prepare you for is the gap between a well-constructed thesis and the moment you present it to a decision-maker who has already made up their mind.
The most common pitfall is not analytical error — it is confirmation bias embedded in the scoping phase. Analysts tend to define NAICS boundaries in ways that include the signals they want to see and exclude the ones that complicate the picture. A team that is enthusiastic about precision fermentation will naturally pull the patent data for fermentation-specific CPC classes and miss the competing patents being filed under synthetic biology classifications that could disrupt the same market from a different angle. The fix is simple but uncomfortable: ask a sceptic to define the scope independently, then reconcile the two versions before gathering data.
The second pitfall is treating validation as a formality. Three expert interviews that all confirm the thesis are not validation — they are selection bias. Seek out the practitioner who thinks the sector will not develop as expected, and make them argue their case. If you cannot rebut their objection with evidence, the thesis is not ready.
A habit worth building: a weekly 30-minute scan of new patent filings, funding announcements, and job-posting changes for your monitored sectors, combined with a monthly framework review. CurvedTrading's research describes a similar nightly-scan, weekly-re-rank routine as a high-signal habit for finding early themes before broad market recognition. The discipline of the routine matters as much as the sophistication of the framework.
Ontherice accelerates the screening and monitoring phases
The most time-consuming parts of this playbook are also the most mechanical: scanning hundreds of data sources for signal convergence, normalising outputs into a comparable format, and maintaining a live monitoring dashboard across a dozen candidate sectors. That is precisely where Ontherice delivers the sharpest advantage.

Ontherice's AI engines ingest global public data continuously, extract the quantitative signals from the metrics table above (funding rounds, hiring velocity, patent activity, search trends), and surface ranked sector candidates with transparent signal provenance — so you know exactly which data points drove a ranking, and you can apply your own framework analysis on top. The AI Opportunities feed maps directly to the screening phase of this playbook, delivering a pre-ranked shortlist you can take straight into Porter and PESTEL analysis. The AI Tools suite supports ad-hoc queries when a signal needs deeper investigation. For analysts tracking consumer and product sectors, the Emerging Brands feed adds brand-level trend signals that complement the sector-level view.
Ontherice surfaces signal provenance at every step and is built on the premise that human validation is non-negotiable. The platform accelerates discovery; your judgement determines the thesis. Start with the AI Opportunities feed to run your first sector screen.
Sources
The sources below are the primary references for populating each phase of the checklist. Record the source name, URL, and retrieval date for every signal you use — provenance is what separates a defensible thesis from an assertion.
- Market research and competitive analysis | SBA
- Typical Steps in Industry Analysis - Porter's Five Forces ...
- Sector analysis | Investopedia
- 2026 Emerging Markets Outlook | Ashmore Group
- Emerging markets mid‑year outlook 2026 | Lazard Asset Management
- How to find emerging themes & sectors: 8‑step framework | CurvedTrading
Always record the retrieval date alongside the source URL. Sector signals move fast; a patent count from six months ago may already be materially out of date by the time you present the thesis.
This article is general information, not a substitute for advice from a qualified financial advisor. Consult a qualified financial professional about your own circumstances before acting on anything here.