
Spot a rising product or sector market before it reaches mainstream awareness by monitoring five signal categories in sequence: leading signals (VC funding, patents, early-adopter activity), coincident signals (search trends, job postings, pricing shifts), lagging signals (earnings, regulation, mainstream adoption), infrastructure readiness, and cross-source convergence. The decision rule is simple: monitor until two or more source types align, validate with at least one domain expert, then pilot.
- Leading: VC deal flow, patent filings at the UK Intellectual Property Office, early-adopter communities
- Coincident: Google Trends relative index, job-posting growth, revenue or pricing shifts
- Lagging: published earnings, regulatory frameworks, mainstream press coverage
- Infrastructure readiness: enabling systems (logistics, connectivity, supply chain) that gate mass adoption
- Cross-source convergence: signals from two or more independent source types pointing the same direction
If your score clears the pilot threshold (see Section 7), stop monitoring and run a bounded experiment.
Key takeaways
A robust emerging market checklist requires five signal categories, cross-source convergence from at least two independent source types, a scored rubric, and a quarterly decision gate to convert signals into funded pilots.
| Point | Details |
|---|---|
| Five signal categories | Monitor leading, coincident, lagging, infrastructure readiness, and cross-source convergence in sequence. |
| Velocity over volume | A signal rising 30% month-on-month from a low base outweighs a high-volume plateau; require 6+ months of sustained growth. |
| Convergence rule | Escalate only when ≥2 independent source types align; single-source signals are noise until corroborated. |
| Scoring rubric | Weight relevance (the highest relevance weighting), momentum (the next highest weighting), and validation (the remaining weighting); score ≥4.0 triggers a pilot within 30 days. |
| Ontherice | Automates signal scanning, ranking, and scoring across multiple categories via its AI-powered platform and signal cards. |
Table of Contents
- What does each signal on the emerging market checklist actually mean?
- How should you weight leading, coincident, and lagging signals?
- What concrete KPIs should you track for each signal?
- Which UK data sources should you monitor?
- How do you run the signal detection framework step by step?
- How do you convert signals into a composite trend score?
- Alert templates you can copy and paste right now
- How do you separate real signals from noise?
- How do you embed this into your team's decision cadence?
- Copyable one-page checklist and KPI dashboard template
- How Ontherice operationalises the checklist for strategy teams
- What experienced trend practitioners get wrong
- Ontherice: signal intelligence without the manual overhead
- Sources
What does each signal on the emerging market checklist actually mean?
Each category has a different lead time and a different failure mode. Knowing both stops you from acting too early or too late.
Leading signals arrive 12–24 months before mainstream demand for VC funding and 24–36 months for patent filings. A cluster of UKIPO filings in a narrow technology class is a concrete early signal; a single filing is noise. Watch for new Companies House incorporations in a sector that had none the previous year — a sudden cohort of fintech or medtech registrations in a single SIC code is exactly this pattern.

Coincident signals track in near real-time. A Google Trends relative index climbing from 20 to 60 over six months matters far more than a static reading of 80 that has not moved. ONS job-category data showing a new occupation code gaining postings is a coincident signal with a 6–12 month lead on revenue.
Lagging signals confirm what leading and coincident signals suggested. Regulation is the clearest: the FCA publishing a consultation paper on a new financial product class means the market already exists and regulators are catching up.
Pro Tip: Velocity matters more than raw volume. Customer language in reviews and social content often leads brand listings by several months — watch the words buyers use before the products exist.
How should you weight leading, coincident, and lagging signals?
The intuition is straightforward: leading signals give you time but carry high uncertainty; lagging signals carry high confidence but leave little time to act. Weight accordingly.
| Signal type | Example | Typical lead time | Confidence |
|---|---|---|---|
| VC / PE funding | Seed rounds in a new category | 12–24 months | Low–medium |
| Patent filings | UKIPO family clusters | 24–36 months | Low–medium |
| Job postings | New role titles on LinkedIn/Indeed | 6–12 months | Medium |
| Google Trends | Relative search index | Real-time | Medium |
| Earnings / regulation | FCA consultation, public filings | 0–3 months | High |
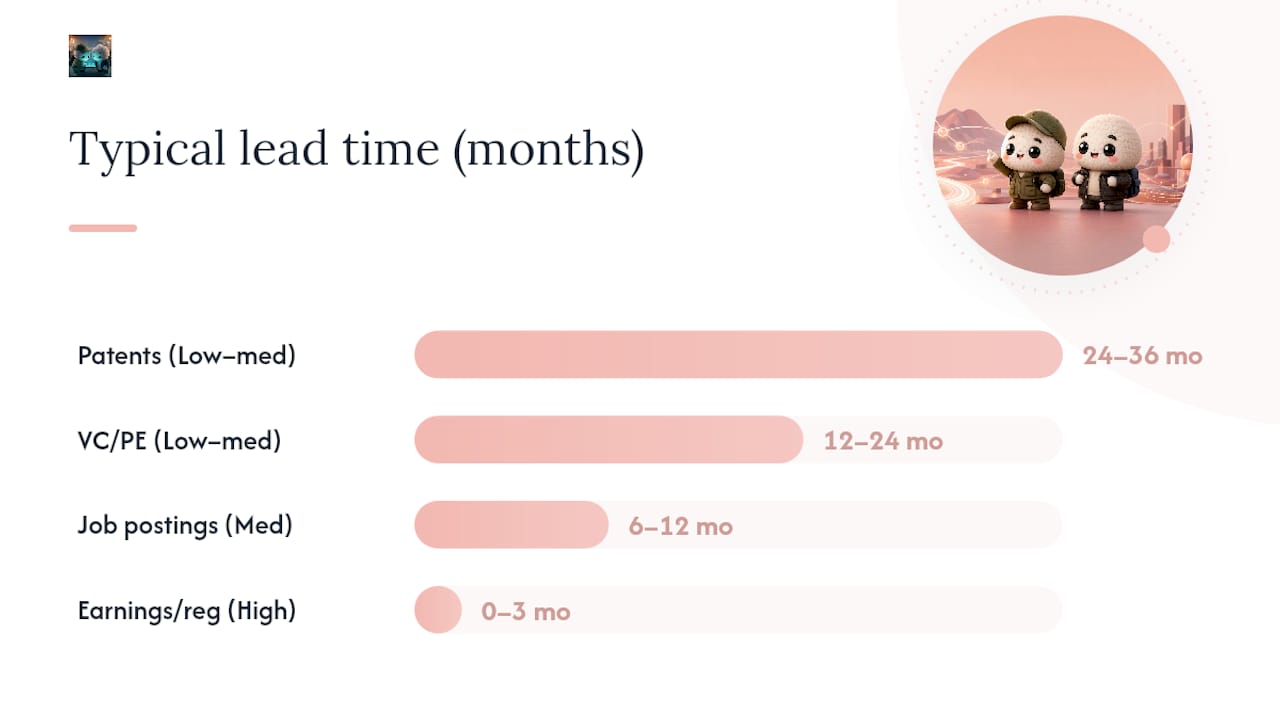
A useful mental model: trace a hypothetical UK sector from first UKIPO patent cluster (month 0) through a Crunchbase funding spike (month 12), a Google Trends acceleration (month 18), an ONS job-category surge (month 24), to enterprise deployment and FCA engagement (month 30–36). Each stage narrows uncertainty and raises the confidence weight you assign.
What concrete KPIs should you track for each signal?
Precise metric definitions matter. Two analysts measuring "job posting growth" differently will reach different conclusions from the same data.
| Signal | KPI | Measurement window | Example UK threshold |
|---|---|---|---|
| VC deal count | New deals in category (Crunchbase/Dealroom) | Rolling 90 days | 3+ deals in 90 days from zero |
| Patent families | UKIPO filings in a technology class | Rolling 12 months | 5+ new families in class |
| GitHub activity | Stars + commit velocity on topic repos | Rolling 30 days | 20%+ commit growth MoM |
| Google Trends index | Relative index, UK filter | 12-month rolling | Index rise from 20 to 60 |
| Job postings | New role titles by SIC/ONS category | Rolling 60 days | growth exceeding the baseline threshold |
| LinkedIn skill adds | Skill endorsements in a category | Rolling 90 days | Consistent upward trend |
| Companies House | New incorporations in SIC code | Rolling 12 months | 2× prior-year cohort |
These thresholds are starting points. Calibrate them to your sector's baseline scale before treating any single breach as a signal.
Which UK data sources should you monitor?
The recommended monitoring stack covers eight sources. Each detects a different signal type.
Office for National Statistics (ONS) — employment and output data by sector. Best for coincident signals: new occupation codes and SIC-category job growth. Free. Filter by Standard Occupational Classification to catch emerging role titles before they appear in mainstream press.
Companies House — new incorporations, director changes, SIC code shifts. Free bulk download available. Query a SIC code annually to spot cohort formation.
UK Intellectual Property Office (UKIPO) — patent and trade mark filings. Free search. Filter by International Patent Classification (IPC) code to find technology clusters.
Crunchbase / Dealroom — funding pipelines, acquisition activity, investor thesis shifts. Paid tiers unlock full query depth; free tiers give enough for initial scans. Filter by UK HQ and funding stage.
Google Trends — real-time relative search demand. Free. Always apply the UK geographic filter and compare against a stable reference term to avoid index distortion.
GitHub — developer activity on open-source projects. Free. Watch repository star counts and commit frequency for technology-adjacent signals.
LinkedIn — job postings and skill endorsement growth. Paid recruiter access gives the cleanest data; free search gives directional signals. Filter by UK location and job function.
Niche forums and academic repositories — subreddits, preprint servers (arXiv, SSRN), investor newsletters. Signal mining upstream in fringe communities frequently surfaces named but still weak signals before mainstream coverage.
How do you run the signal detection framework step by step?
Trend analysis works best as a continuous rhythm, not a one-off activity. This five-step process gives your team a repeatable structure.
- Define the search space. Name the sector, technology class, or product category. Set the IPC codes, SIC codes, and keyword list you will track. Document them so the baseline is reproducible.
- Establish the baseline. Pull 12–24 months of historical data for each KPI. Calculate mean and standard deviation. A signal only becomes meaningful when it exceeds the historical variance by a defined margin (suggested: 1.5× standard deviation for initial alert, 2× for escalation).
- Monitor on cadence. Weekly: Google Trends, Reddit, investor newsletters. Monthly: Crunchbase/Dealroom deal counts, LinkedIn job postings, GitHub commit velocity. Quarterly: ONS employment data, Companies House cohort counts, UKIPO filing clusters.
- Evaluate significance. Apply the five-step forecasting framework: cross-industry pattern recognition, weak-signal detection, inflection-point analysis, stakeholder impact mapping, scenario planning. A signal passes evaluation when it exceeds the threshold AND shows sustained growth over 6+ months.
- Validate and act. Before piloting, confirm cross-source convergence (≥2 independent source types), infrastructure readiness, and at least one domain expert interview. Then move to a bounded pilot with a defined success metric and exit criterion.
How do you convert signals into a composite trend score?
A scoring rubric makes trends comparable across categories and removes the subjectivity from "this feels big." Score each trend on three dimensions, then multiply.
| Dimension | Weight | Score 1–5 | Notes |
|---|---|---|---|
| Relevance | the highest relevance weighting | 1 = tangential, 5 = core to strategy | Assess against your business model |
| Momentum | the next highest weighting | 1 = flat, 5 = accelerating >30% MoM | Use velocity, not volume |
| Validation | the remaining weighting | 1 = single source, 5 = ≥3 source types + expert | Cross-source convergence required |
Weighted score: (5 × 0.40) + (4 × 0.35) + (4 × 0.25) = 2.0 + 1.4 + 1.0 = 4.4 out of 5.
Governance rules: Score ≥4.0 = move to pilot within 30 days. Score 2.5–3.9 = monitor monthly and re-score at next quarterly review. Score <2.5 = archive with a dated note; revisit only if a new signal triggers re-evaluation. The Ontherice rankings engine automates this scoring across multiple categories simultaneously.
Pro Tip: Build your trend evaluation criteria before you see the first signal. Criteria set after the fact are rationalisation, not analysis.
Alert templates you can copy and paste right now
Set these up once and let them run. The goal is a daily digest you can triage in ten minutes, not a constant stream of notifications.
Google Alerts: "[technology keyword]" site:gov.uk OR site:ipo.gov.uk for regulatory signals. "[sector] funding" OR "[sector] investment" UK for deal flow. Set to "At most once a day" and route to a dedicated inbox.
Crunchbase / Dealroom: Save a query for UK-headquartered companies in your target category, funded in the last 90 days, seed to Series B. Set email digest to weekly.
GitHub watchers: Star and watch the top 5 repositories in your technology class. Enable release notifications. Track star count weekly in a simple spreadsheet.
LinkedIn / Indeed job boards: Set a saved search for a new role title (e.g. "AI safety engineer" or "circular economy analyst") filtered to UK, posted in the last 7 days. Review weekly.
Google Trends snapshot: Every Monday, open Google Trends, apply UK filter, compare your keyword against a stable reference term, and log the relative index in your KPI sheet.
Frequency rule: daily digest for Google Alerts and LinkedIn; weekly review for GitHub, Crunchbase, and Trends; monthly deep-read for ONS and Companies House bulk data.
How do you separate real signals from noise?
Most alerts are noise. A triage checklist stops you wasting a pilot budget on a blip.
Reject a signal if it meets any of these conditions: it appears in only one source type; the spike lasted fewer than four weeks; the growth is category-wide with no acceleration in your specific sub-segment; or the underlying driver is a single media event (a BBC documentary, a government announcement with no follow-through).
Require all three of the following before escalating to the scoring stage: cross-source convergence from at least two independent source types; persistence over six or more months for demand signals; and a positive infrastructure readiness check (the enabling systems exist or are being built).
Velocity and acceleration over time are more informative than high-volume steady metrics. A false positive pattern to recognise: a Google Trends spike that coincides with a single news cycle, shows no corresponding job-posting growth, and disappears within eight weeks. That is a media event, not a market.
How do you embed this into your team's decision cadence?
Signals that stay in a spreadsheet do not become decisions. A living trend radar, an expert review panel, and direct routing into the innovation or investment pipeline are the organisational practices that close the loop.
Roles: Assign a trend owner (monitors and scores), a data steward (maintains source access and baseline integrity), a domain expert (validates signals against sector knowledge), and a decision sponsor (owns the pilot budget).

Cadence: Weekly signals digest (trend owner reviews alerts, flags anything above 1.5× baseline). Monthly pattern review (trend owner and domain expert re-score active trends, archive dead ones). Quarterly strategy panel (decision sponsor reviews all trends scoring ≥2.5, approves pilots for those scoring ≥4.0).
Decision gate checklist (required before a pilot is approved): trend score ≥4.0 confirmed; cross-source convergence from ≥2 source types; infrastructure readiness confirmed; stakeholder impact mapped; pilot scope, budget, and success metric defined; audit trail of alerts and validations documented.
Copyable one-page checklist and KPI dashboard template
Paste this into a spreadsheet. One row per signal, updated on the cadence shown.
Dashboard KPIs to display on a single view: composite trend score (0–5), top three signals by velocity, source convergence count, weeks of sustained growth, and pilot-readiness flag (yes/no). For a UK sector, prefill the Companies House row with your target SIC code, the UKIPO row with the relevant IPC class, and the ONS row with the Standard Occupational Classification code for the emerging role type.
How Ontherice operationalises the checklist for strategy teams
Running this checklist manually across eight sources is feasible for a single trend. For a portfolio of ten or more, the data-wrangling overhead quickly outpaces the analytical value. Ontherice maps directly to each checklist stage: its AI engines scan public data continuously, surface signal cards ranked by momentum and relevance, and feed a live rankings engine that applies a scoring framework comparable to the rubric above.
A strategy team tracking UK fintech signals, for example, can query Ontherice's live AI for early signals across funding, patents, and job categories simultaneously, then export ranked signal cards for the monthly pattern review. The platform's AI Opportunities feed surfaces sector-level signals before they appear in mainstream coverage, which is precisely the lead-time advantage the checklist is designed to capture. Ontherice also maintains transparent prediction accuracy tracking, so teams can audit which signal types have historically led to confirmed trends in their category.

The Ontherice blog includes sector walkthroughs and tutorials that shorten the setup time for new monitoring programmes. Start by browsing the signal card examples, then connect your own source queries to the platform's alert layer.
What experienced trend practitioners get wrong
The checklist is not the hard part. The hard part is the discipline to wait for convergence before acting and to archive a trend when the score drops rather than rationalising continued monitoring.
The most common pitfall is acting on a single-source signal. A Crunchbase funding spike with no corresponding UKIPO activity, no Google Trends movement, and no job-posting growth is a funding event, not a market signal. The second most common is ignoring infrastructure readiness. EV adoption in the UK accelerated only after charging network density crossed a practical threshold — the demand signal existed years before the infrastructure caught up, and pilots launched too early burned budget.
On cadence: the quarterly review is where most programmes stall. The monthly digest keeps signals warm; the quarterly panel is where decisions actually get made. If the decision sponsor does not attend the quarterly panel, the programme produces research, not strategy.
Run validation interviews before scoring, not after. An expert who confirms a signal before you score it is a validation input. An expert consulted after you have already decided to pilot is a rubber stamp.
Ontherice: signal intelligence without the manual overhead
Manually running the checklist across eight sources for a single trend takes roughly two to three hours per week. Across a portfolio of trends, that overhead compounds fast. Ontherice cuts that time by scanning public data continuously and surfacing pre-scored signal cards ranked by momentum, so your team reviews conclusions rather than raw feeds.
The platform's AI Opportunities feed is the fastest entry point for professionals who want the checklist's output without building the monitoring stack from scratch. Signal cards cover finance, technology, products, jobs, and brands, with transparent scoring you can audit against the rubric in this article. Browse the live signal rankings to see which UK sectors are currently accelerating, then connect your own source queries for the categories that matter to your strategy.
Sources
- skills/trend-analysis/references/trend-signals.md
- Market trend analysis for consumer brands | Indellia
Minimal starter set for a UK sector: ONS (coincident baseline), UKIPO (leading patents), and Google Trends (real-time demand). Add Crunchbase once you have a baseline to compare against.