TL;DR:
- Cross-sector insight coordination integrates data and perspectives from multiple organizations to improve strategic decision-making. Shared measurement is essential for success, with a dedicated backbone team ensuring data quality and alignment. Building trusting, inclusive relationships through governance, continuous learning, and regular dialogue transforms shared data into impactful decisions.
Cross-sector insight coordination is the process of integrating data and perspectives from multiple organisations into unified intelligence that drives better strategic decisions. Business analysts and strategists who master this process gain a measurable edge: they spot patterns that single-sector teams miss entirely. The Kania and Kramer Collective Impact Model, published in 2011, remains the most cited framework for achieving this. Understanding how to coordinate cross-sector insights starts with recognising that shared measurement, not shared goals, is the operational core that makes everything else work.
What foundational elements enable cross-sector insight coordination?
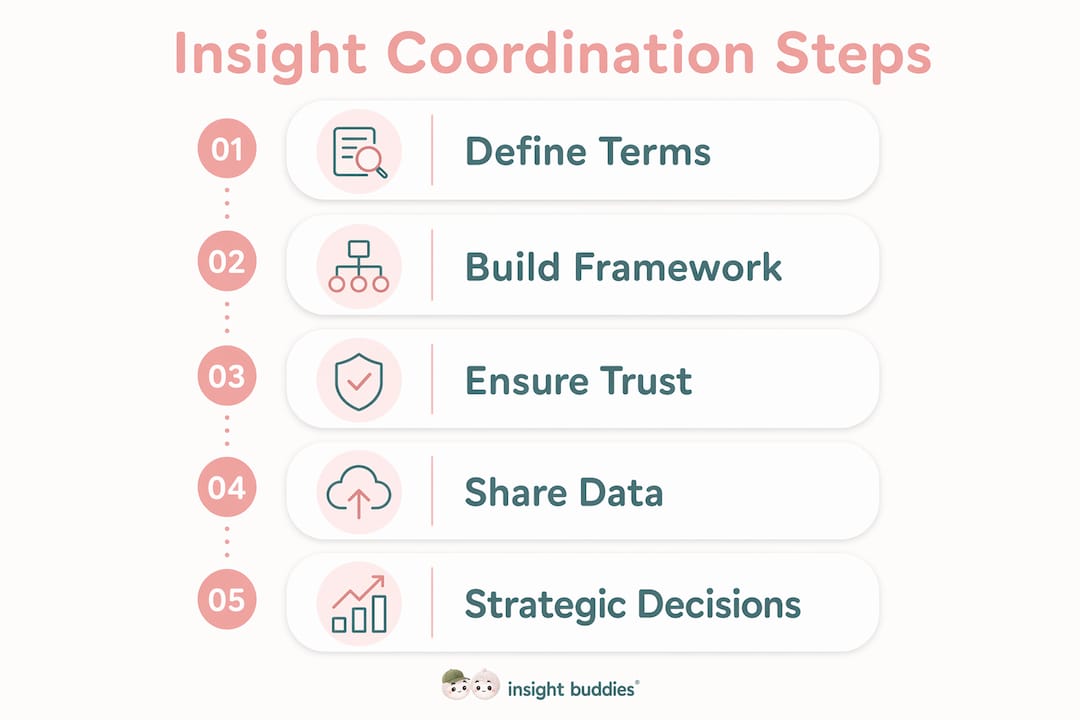
The Collective Impact Model defines five conditions that must coexist for cross-sector coordination to succeed: a common agenda, shared measurement, mutually reinforcing activities, continuous communication, and backbone support. Each condition depends on the others, but shared measurement is the one that operationalises the rest. Without it, organisations may agree on direction but cannot confirm whether they are moving together.

A common agenda means all participating organisations agree on the problem definition and the theory of change. This sounds straightforward, but in practice it requires structured facilitation across groups with different vocabularies, incentives, and reporting cultures. Mutually reinforcing activities means each partner contributes distinct work that complements rather than duplicates the others. That distinction matters because it prevents duplication of effort and surfaces genuine gaps in the collective strategy.
Continuous communication keeps the coordination alive between formal reporting cycles. It is not enough to share a quarterly dashboard. Partners need regular, structured dialogue that surfaces emerging signals and flags measurement divergence before it compounds. Backbone support, the fifth condition, refers to a dedicated team or organisation that manages the coordination infrastructure so no single partner carries that burden alone.
- Common agenda: Shared problem definition and agreed theory of change across all partners
- Shared measurement: Standardised indicators and data definitions that allow comparison
- Mutually reinforcing activities: Distinct contributions that complement rather than overlap
- Continuous communication: Regular structured dialogue beyond formal reporting cycles
- Backbone support: A dedicated coordination team managing infrastructure and data quality
Pro Tip: Before your first cross-sector workshop, circulate a one-page glossary of key terms. Misaligned definitions are the most common source of measurement divergence, and fixing them early saves months of reconciliation later.
How do you build a shared measurement framework?
Building a shared measurement framework transforms a loose network of organisations into a genuine learning community. The process requires investment in standardised indicators, agreed data definitions, and dedicated infrastructure managed by a backbone organisation. The payoff is accountability and collaborative learning that no single organisation can generate alone.
Follow these steps to build your framework:
- Define shared indicators collaboratively. Bring representatives from each sector together to agree on what success looks like. This process often reveals collaboration gaps that partners had not previously noticed, deepening mutual understanding before data collection even begins.
- Standardise data definitions and confidentiality rules. Agree on exactly what each indicator means, how it is measured, and what data can be shared externally. Without this step, organisations collect locally but cannot compare across the network.
- Establish a backbone organisation or coordination team. This team manages data quality, maintains consistent definitions, and coordinates the reporting calendar. Without backbone support, collective impact efforts fail because incompatible measurements make local data unusable at the network level.
- Select your tools and infrastructure. Choose software platforms and dashboards that all partners can access and afford. The tool matters less than the agreement on what it measures.
- Set a realistic timeline and resource commitment. Shared measurement is a collective performance journey, not a one-off project. Budget for ongoing coordination, not just initial setup.
The table below compares three common infrastructure approaches for cross-sector measurement:
| Infrastructure Model | Best For | Key Limitation |
|---|---|---|
| Centralised backbone team | Large, funded coalitions | High coordination cost |
| Rotating lead organisation | Smaller, peer networks | Risk of inconsistency |
| Shared software platform only | Data-mature partners | Weak on relational governance |
Pro Tip: Design your indicator architecture and governance layers at the same time. Practitioners who build governance after the data model find that incompatible structures make their data unusable later. This is confirmed by early governance design principles used by experienced evaluation teams.
For analysts who want to see how this plays out in practice, multidisciplinary trend analysis examples illustrate how coordinated measurement across sectors produces strategic insights that single-sector analysis cannot replicate.
How do relational dynamics shape cross-sector knowledge integration?
The biggest mistake analysts make in cross-sector collaboration is treating it as a purely technical problem. Cross-sector insight coordination requires both technical data management and attentive process design that addresses trust, equity, and reflexivity. Ignore the relational layer and your measurement framework will stall regardless of how well it is designed.
The four P's framework, drawn from knowledge co-production research published in Nature, gives you a diagnostic tool for the relational layer:
- Positionality: Who is in the room, and what assumptions do they bring? Each partner's institutional context shapes how they frame problems and interpret data.
- Purpose: Why is each organisation participating? Misaligned motivations produce surface-level engagement and undermine shared measurement over time.
- Power: Power differentials influence funding decisions, problem framing, methods, participation, outputs, and who ultimately benefits. Documenting these differentials before workshops prevents them from distorting governance later.
- Process: How are decisions made, and who has access to those decisions? Transparent process design is what converts goodwill into durable governance.
Trust is not a soft add-on. It is the mechanism through which partners share sensitive data, flag measurement problems honestly, and sustain engagement through difficult periods. Building trust requires explicit governance: documented decision rights, clear escalation paths, and regular opportunities for partners to raise concerns without penalty.
Equity in cross-sector collaboration means ensuring that smaller or less-resourced partners have genuine influence over shared indicators, not just nominal representation. Explicitly documenting power and decision-making access before the first workshop is one of the most practical steps you can take. It surfaces assumptions early, when they are still easy to address.
Understanding partnership principles at a foundational level helps analysts distinguish between transactional data-sharing arrangements and genuine cross-sector collaboration. The distinction determines whether your coordination effort produces learning or just reporting.
What practical steps turn coordinated insights into strategic decisions?
Coordinated insights only create value when they feed directly into decision-making cycles. Continuous communication supported by shared measurement instruments leadership learning loops rather than producing activity without insight accumulation. The difference between a reporting exercise and a learning loop is whether the data changes what partners do next.
Use this sequence to operationalise your coordinated insights:
- Set a reporting cadence. Monthly dashboards work for operational decisions. Quarterly reviews work for strategic ones. Match the cadence to the decision cycle, not to data availability.
- Build feedback loops into the process. After each reporting cycle, hold a structured review where partners discuss what the data revealed, what surprised them, and what they will change. This is what distinguishes measurable learning loops from mere communication.
- Monitor for measurement divergence. When partners report the same indicator differently, address it immediately. Divergence compounds quickly and erodes trust in the shared framework.
- Maintain alignment through mutual respect. Partners who feel their contributions are valued stay engaged through difficult periods. Recognition of each sector's distinct expertise is not a courtesy. It is a coordination mechanism.
The table below compares two common approaches to cross-sector reporting:
| Approach | Strengths | Weaknesses |
|---|---|---|
| Centralised dashboard reporting | Consistent format, easy comparison | Can obscure context-specific variation |
| Narrative plus data reporting | Captures qualitative nuance | Harder to compare across partners |
For analysts building industry signal identification capabilities, integrating cross-sector data into a structured reporting cadence is the step that converts raw signals into decisions. The cross-sector trend mapping guide from Ontherice offers a practical companion framework for structuring that process.
Biggest failures in collective impact arise from missing shared measurement rather than disagreements on goals. That finding reframes where analysts should invest their attention: less on consensus-building workshops, more on measurement infrastructure.
Key takeaways
Coordinating cross-sector insights succeeds when shared measurement infrastructure, relational governance, and continuous learning loops operate together as a single system.
| Point | Details |
|---|---|
| Shared measurement is the core | Without standardised indicators and data definitions, coordination produces activity but not learning. |
| Backbone support prevents failure | A dedicated coordination team maintains data quality and consistent definitions across all partners. |
| Relational governance is non-negotiable | The four P's framework surfaces power, purpose, and positionality before they distort your process. |
| Feedback loops create strategic value | Structured post-reporting reviews are what convert shared data into decisions that change behaviour. |
| Document power differentials early | Addressing decision-making access before workshops prevents trust breakdowns that are costly to repair later. |
Why governance deserves more attention than the data model
Most analysts I have worked with arrive at cross-sector coordination projects focused on the data architecture. They want to know which platform to use, how to standardise definitions, and what the reporting cadence should be. Those are the right questions, but they are the second set of questions, not the first.
The first set is about governance. Who decides what gets measured? Who has the right to flag a problem with the shared framework? What happens when a powerful funder's preferred indicator conflicts with what the data actually shows? I have seen well-funded coordination efforts collapse not because the measurement system was wrong, but because no one had documented who held decision-making authority when disagreements arose.
Relational politics and governance are as important as technical data coordination. That is not a soft observation. It is a structural one. The organisations that get cross-sector coordination right invest in governance design before they invest in dashboards. They treat the four P's framework as a design input, not a retrospective audit.
The other thing I would say from experience: shared indicator development is worth more than it appears. The process of sitting with partners and agreeing on what to measure surfaces assumptions, reveals misaligned incentives, and builds the kind of mutual understanding that no workshop exercise can replicate. The indicator list is almost secondary. The conversation that produces it is the real output.
Embrace continuous learning as a design principle, not a stated aspiration. Build review cycles into your governance documents. Make it structurally easy for partners to say "this metric is not telling us what we thought it would." That kind of reflexivity is what separates coordination efforts that adapt and survive from those that calcify and eventually collapse.
— Aidil
Discover ontherice's tools for cross-sector intelligence
Coordinating insights across sectors requires infrastructure that can handle real-time signals from diverse data sources. Ontherice builds exactly that.
The SignalsInternational platform scans global data points across multiple markets, producing rankings and scores that support shared measurement across sectors. For analysts who need a broader view, GeneralSignals provides generalised tools for measuring and integrating sector insights efficiently, with transparent ranking methodologies that make cross-sector comparison straightforward. Both platforms are built for professionals who need early signals before trends reach mainstream awareness. Explore how Ontherice's AI-driven intelligence can support your coordination infrastructure.
FAQ
What is cross-sector insight coordination?
Cross-sector insight coordination is the process of integrating data and perspectives from multiple organisations or industries into unified intelligence. It enables better strategic decisions by surfacing patterns that single-sector analysis misses.
Why does shared measurement matter more than a common agenda?
The biggest failures in collective impact arise from missing shared measurement, not from disagreements on goals. A common agenda without standardised indicators produces aligned intentions but incomparable data.
What is a backbone organisation in cross-sector collaboration?
A backbone organisation is a dedicated team that manages coordination infrastructure, maintains data quality, and ensures consistent measurement definitions across all partners. Without it, local data collection produces incompatible results.
How do the four p's help with cross-sector governance?
The four P's framework, covering Positionality, Purpose, Power, and Process, surfaces how context shapes decision-making and ensures inclusivity. Documenting power and decision-making access before workshops prevents governance failures later.
How often should cross-sector partners review shared data?
Monthly dashboards suit operational decisions, while quarterly structured reviews work better for strategic alignment. The cadence should match the decision cycle, not data availability, and every review should include a structured discussion of what the data changed.