
AI-detected industry momentum is rising real-world traction for a sector, measured through signal scores, rankings and early-warning trends pulled from public data before that traction shows up in conventional research. Evaluating it means three things, in order: define the universe of sectors you actually care about, check at least three high-confidence signals for agreement, then issue a watch or validate flag rather than a final call. AI visibility data typically runs 4 to 12 weeks ahead of traditional market research, which is why a structured signal framework matters more than gut feel. Ontherice builds its rankings around exactly this process.
- Define your sector universe and the hypothesis you're testing
- Cross check three or more independent signal categories
- Flag for watch, validation, or escalation, never a snap decision
Key Takeaways
Evaluating AI-detected industry momentum requires cross-confirming multiple independent signal sources against a learned baseline before converting any single spike into a business decision.
| Point | Details |
|---|---|
| Define before collecting | Set your sector universe and hypothesis first, or you'll chase every spike that appears. |
| Cross-confirm across sources | Treat a single-signal spike as noise; require convergence across at least three independent categories. |
| Use thresholds as guides, not laws | A 30%+ YoY search inflection and 20%+ MoM job growth are starting points, adjust for industry speed. |
| Log signals for weeks, not days | Keep at least four weeks of logged evidence before upgrading a pattern to a confirmed trend. |
| Ontherice scores convergence transparently | Ontherice ranks sectors with visible source provenance and tracked prediction accuracy, free to browse. |
Table of Contents
- How do you measure momentum once you have the data?
- A six-step workflow for evaluating momentum consistently
- How do you avoid false positives in momentum signals?
- Turning signals into a decision: scoring and prioritisation
- Worked example: from raw signal to recommended action
- Customising momentum parameters across industries and conditions
- Where expert judgment still beats the algorithm
- Which tools actually help you run this workflow?
- What does successful AI-driven momentum evaluation look like in practice?
- How Ontherice applies this workflow day to day
- Try Ontherice for your own momentum tracking
- Frequently asked questions
- Sources
How do you measure momentum once you have the data?
Five metrics turn raw signals into something you can rank and compare.
- Strength: the absolute level of activity right now, against its historical range for that category.
- Velocity: the rate of change over a set window, typically month over month.
- Acceleration: whether velocity itself is increasing, the second derivative that separates a fad from a build.
- Persistence: how many consecutive periods the signal has held direction, filtering out one-off spikes.
- Signal-to-noise: how much of the movement is explained by real underlying activity versus reporting volume or seasonal churn.
Example thresholds worth testing against your own universe: a search-demand inflection of 30%+ year-on-year and job-posting growth of 20%+ month-on-month both tend to mark genuine entry points rather than noise. These aren't universal laws, industries with long sales cycles need looser thresholds, and fast-moving consumer categories need tighter ones.
Regime-change detection works by learning a baseline rhythm for a sector, then flagging deviations from that rhythm rather than chasing absolute numbers. This is faster than manual tracking but fragile around genuinely unprecedented events, where there's no historical baseline to deviate from.
Statistic callout: Expect a typical lead time of several weeks between an AI-flagged deviation and its confirmation in traditional research; the EchoNerve Signal Framework recommends multi-week evidence before promoting any single signal to a confirmed trend.
A six-step workflow for evaluating momentum consistently
Running this as an ad hoc exercise produces inconsistent calls. A repeatable process fixes that.
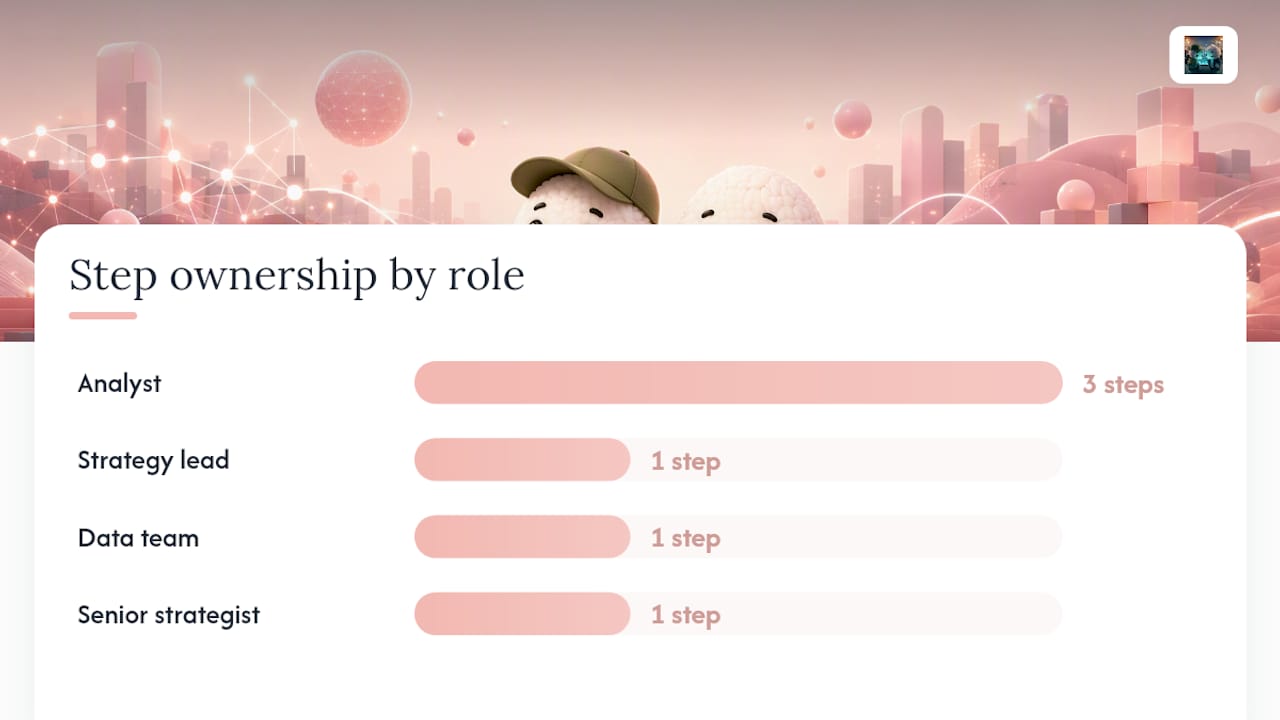
- Define universe and hypotheses. Pick the sectors or sub-sectors you're tracking and write down what you expect to see if momentum is real. Owner: strategy lead. Capture: sector list, hypothesis statement.
- Establish baseline rhythm. Chart normal seasonal and cyclical patterns for each signal source before you start hunting for deviations. Owner: analyst. Capture: 12 month rolling baseline per source.
- Collect signals. Pull data across the nine source categories on a fixed schedule rather than opportunistically. Owner: data team. Capture: raw feed snapshots, timestamped.
- Engineer features and score. Convert raw numbers into strength, velocity, acceleration and persistence scores. Owner: analyst. Capture: scored dataset per sector.
- Detect deviations and rank. Flag sectors whose scores break away from baseline and rank them by convergence across sources. Owner: analyst. Capture: ranked shortlist with supporting signals.
- Validate and escalate. Cross check the top candidates against qualitative sources before anyone acts on them. Owner: senior strategist. Capture: validation notes, decision log.
Run signal collection daily, feature scoring weekly, and full validation monthly, tightening that cadence for fast-moving categories like crypto or consumer tech. A step-by-step market intelligence process built around this rhythm keeps the workload manageable without losing the early signal advantage.
Pro Tip: Automate the baseline comparison rather than eyeballing charts each week. A simple rolling-average script catches drift long before a human analyst notices the pattern.
How do you avoid false positives in momentum signals?
Validation is where most teams cut corners, and it's where most bad calls originate.
- Backtest your scoring model against sectors you already know rose or fell, and check whether it would have flagged them early.
- Hold out a slice of historical data the model never saw during tuning, then test against it separately.
- Cross-confirm across sources before treating any single spike as real.
- Correct for seasonality so a predictable annual bump doesn't masquerade as a structural shift.
- Keep a human in the loop for anything that would trigger real spending or strategic pivots.
Track precision (how often flagged signals turn out real), recall (how many real trends you actually caught), lead time, and false positive rate. A model with high recall but a high false positive rate will bury real signals in noise.
Three biases distort interpretation repeatedly: echo chambers where the same underlying event gets reported by multiple outlets and looks like independent confirmation, media amplification that inflates volume without adding new evidence, and data sparsity in niche sectors where thin data makes normal variance look dramatic. Weighting sources by independence, not just volume, is the single best mitigation.
Turning signals into a decision: scoring and prioritisation
Adjust the weighting for your risk appetite, investors chasing early entry might weight velocity higher; operators building products might weight persistence instead.
Three decision gates keep teams from either ignoring real signals or overreacting to noise:
- Monitor: score is elevated but convergence is weak. Add to a watchlist, take no action.
- Investigate: score is elevated with two or more independent confirmations. Commission a deeper look, maybe a small content push or a scoping call.
- Act: score is high, persistent, and confirmed across three or more source categories. Commit resource, a product experiment, a market entry plan, or investment diligence.
A content team acting on "monitor" wastes a slot. An investor acting on "investigate" as if it were "act" risks capital on unconfirmed noise.
Worked example: from raw signal to recommended action
- Week 1: job postings for a niche materials-science role jump 35% month over month, first flagged by the collection layer.
- Week 2: search demand for the same category rises 28% year on year, still below the 30% inflection threshold but climbing.
- Week 3: two funding rounds appear in filings for companies in that category, an independent confirming signal.
- Week 4: search demand crosses the 30% threshold, all three signal categories now agree.
- Decision point: convergence across hiring, capital and search moves this from "monitor" to "investigate", with a recommendation to commission a scoping brief within 30 days.
- Expected lag: traditional industry reports likely won't reflect this shift for another 6 to 10 weeks, roughly matching the 4 to 12 week AI visibility lead.
Ontherice, this sequence would show up as a rising score on the relevant sector card, with each contributing signal listed against its source so the convergence is visible rather than asserted.
Customising momentum parameters across industries and conditions
Regulated industries, pharmaceuticals, financial services, defence, move through filings and policy signals on a much slower clock than consumer tech. Loosen your velocity thresholds and lengthen your validation window accordingly, or you'll flag routine regulatory chatter as a breakout trend.
Crypto and early-stage tech sectors need the tightest thresholds and shortest baseline windows, since sentiment and capital both move in hours rather than weeks; Ontherice's dedicated crypto signal feed reflects that faster cadence directly in how often scores refresh.
Market conditions matter as much as industry type. During periods of macroeconomic stress, funding-flow data becomes noisier as capital pulls back across the board regardless of sector-specific momentum, so weight it down and lean harder on job postings and product-listing data instead. Seasonal categories, retail, travel, agriculture, need baseline rhythms rebuilt annually rather than assumed static, otherwise every predictable seasonal bump reads as a false breakout.
The practical rule: set your thresholds once per industry class, review them quarterly, and never apply a fast-moving consumer-tech threshold to a slow-moving regulated sector or vice versa.
Where expert judgment still beats the algorithm
AI signal detection is genuinely excellent at spotting deviation from a learned baseline. It is not designed to explain why that deviation happened, and that gap is exactly where human judgement earns its place.

Convergence across signal types (hiring, funding, search, filings) substantially raises confidence that a trend is real rather than noise, but convergence alone doesn't tell you whether a regulatory change is permanent or a temporary policy experiment. That distinction usually needs someone who understands the policy landscape, not just the data feed.
The practical integration point sits at the "investigate" gate described earlier. Once a signal clears that bar, bring in a subject-matter view, a former operator in that sector, a policy analyst, a domain specialist, before committing resource. AI does not predict the future; it flags statistical deviations from a learned baseline and surfaces regime-change candidates faster than manual monitoring alone could manage. The judgement call about what that deviation means still belongs to a person.
This is also where tracking industry momentum properly pays off strategically: teams that treat AI output as a shortlist generator, rather than a verdict, make better calls than teams that treat either pure AI signals or pure gut instinct as sufficient on their own.
Which tools actually help you run this workflow?
Momentum evaluation splits across a few distinct tool categories, and mixing them well matters more than picking one perfect tool.
AI signal and ranking platforms aggregate the nine source categories automatically and score them against a baseline, saving the manual collection work described in the workflow section. Ontherice sits here, purpose-built for the exact convergence-scoring approach this guide describes, with transparent ranking provenance so you can see which sources drove a given score.
General analytics and search-trend tools are useful for the search-demand leg of your signal set but weren't built for cross-source convergence scoring, so they need to feed into a broader process rather than stand alone.
Job-market and filings databases cover the hiring and capital-flow legs but again need manual stitching together unless your platform does it for you.
The practical setup most teams land on: one aggregating platform for the daily signal pull and scoring, supplemented by direct checks against filings or job boards when a specific sector clears the "investigate" gate. Running real-world AI trend examples side by side against manual research is the fastest way to calibrate trust in whichever tool combination you settle on.
What does successful AI-driven momentum evaluation look like in practice?
The clearest illustration is the sequence in the worked example above: hiring data, funding filings and search demand converging inside a four-week window, well ahead of any published industry report acknowledging the shift.
The pattern repeats across sectors. A materials or manufacturing niche shows patent filings and job postings moving together months before mainstream coverage catches on, because filings and hiring both carry long lead times relative to news cycles. A consumer product category shows web traffic and social sentiment moving first, with funding and filings confirming weeks later, the order of signal arrival flips depending on whether the sector is capital-intensive or attention-intensive.
What separates a successful evaluation from a lucky guess is the paper trail: a weekly signal log kept for at least four weeks, with repeated independent confirmations before anyone upgrades a pattern to a trend, as the Signal Framework recommends. Teams that skip that logging step tend to remember their hits and forget their misses, which quietly erodes the reliability of the whole process over time. Teams that keep the log, even an imperfect one, end up with a genuine track record instead of a collection of anecdotes.
How Ontherice applies this workflow day to day
We built the six-step workflow into how Ontherice scores every sector, because convergence across sources, not a single feed, is what separates a real early signal from noise. Every ranking carries visible source provenance and prediction accuracy tracking, so you can check our track record rather than take it on trust. Explore the live rankings and see the convergence scoring in action.
Try Ontherice for your own momentum tracking
Ontherice runs the workflow described above automatically, scanning global public data across the nine signal categories and scoring convergence rather than reacting to a single spike. Where a manual process needs an analyst chasing filings, job boards and search data separately, Ontherice pulls them into one ranked view with the source behind each score visible, not buried.

Three things carry over directly from this guide into the product: real-time signal feeds across finance, tech, crypto and consumer categories; transparent ranking provenance so you can see exactly which sources drove a score; and prediction accuracy tracking with human-in-the-loop review flags on anything that looks like an outlier. The core rankings are free to browse. Access Points unlock deeper signal cards and premium feeds for readers who want to go past the watchlist stage into full investigation.
Start with the rankings overview to see live sector scores, or head straight to the AI opportunity feeds if you already know which category you're tracking.
Frequently asked questions
What counts as AI-detected industry momentum? It's measurable rising traction for a sector, evidenced by convergent signals like job postings, search demand and funding, surfaced by AI before conventional research catches up.
How long before AI signals show up in traditional research? Typically 4 to 12 weeks, though this varies by how capital-intensive or attention-intensive the sector is.
How many signals do I need before acting on a trend? Most practitioner guidance suggests convergence across at least three independent signal dimensions before treating a pattern as a confirmed trend worth acting on.
Can AI signals replace expert judgement entirely? No. AI is strong at flagging deviation from a baseline but doesn't explain the cause, which is why a human-in-the-loop review at the "investigate" gate matters.
Where can I see this scoring approach applied live? Ontherice publishes ranked sector scores with visible source provenance and accuracy tracking across categories including crypto and international markets.
Sources
- How to Predict Market Trends with AI 2026: A Practical Guide | UltraScout AI
- 5 Market Research Indicators for Growth Opportunities - Velox Consultants
- The EchoNerve Signal Framework: How to Spot AI Trends Early