
TL;DR:
- Exploration tools reduce uncertainty through systematic inquiry in both digital analysis and physical geoscience. They enable active questioning, hypothesis testing, and multi-source validation to uncover unknown patterns. Conflating exploration tools with dashboards is a common mistake that hampers effective research and decision-making.
Exploration tools are defined as interactive investigative instruments, either digital software or physical equipment, that enable professionals to discover, analyse, and validate information through systematic inquiry. The term covers two distinct domains: data exploration software used in analytics and market intelligence, and physical instruments deployed in geoscience and mineral prospecting. Platforms such as Domo, Microsoft Sentinel, and NASA's AVIRIS sensor represent the breadth of what exploration tools actually are. Whether you are a market analyst querying a dataset or a geologist mapping subsurface minerals, the underlying logic is the same. You are reducing uncertainty through structured, repeatable investigation.

What are exploration tools in data analysis?
Data exploration tools allow interactive filtering, segmenting, and hypothesis testing across datasets. They are not dashboards. A dashboard presents pre-defined answers. An exploration tool lets you ask questions you did not know you had. That distinction matters enormously for anyone doing serious research or market analysis.
The core capabilities of data exploration software include profiling distributions, spotting anomalies, drilling down into subsets, and testing relationships between variables. Exploration is an active questioning process rather than passive reporting. You form a hypothesis, query the data, revise your assumption, and query again. The loop continues until you reach a defensible conclusion.
Three tools illustrate this well. Domo provides an end-to-end analytics environment where researchers can filter live datasets and surface patterns without writing code. Microsoft Sentinel's exploration interface supports semantic search across tables, schema retrieval, and KQL query execution for focused security and data investigations. dbt Insights supports SQL queries across multiple tabs, query history tracking, and saved results for reproducibility. Each tool serves a different audience, but all three share the same investigative architecture.
Pro Tip: Before querying any dataset, retrieve the schema first. Microsoft Sentinel's workflow makes this explicit: semantic discovery before query execution prevents wasted time guessing column names and data types.
Data exploration vs data visualisation: what is the difference?
| Feature | Data exploration tools | Data visualisation tools |
|---|---|---|
| Primary purpose | Discover unknown patterns | Present known findings |
| Interactivity | High: filter, drill, query | Low to medium: fixed charts |
| User input | Active hypothesis testing | Passive consumption |
| Examples | Domo, Microsoft Sentinel, dbt Insights | Tableau, Power BI |
| Output | Findings, queries, anomalies | Reports, dashboards |
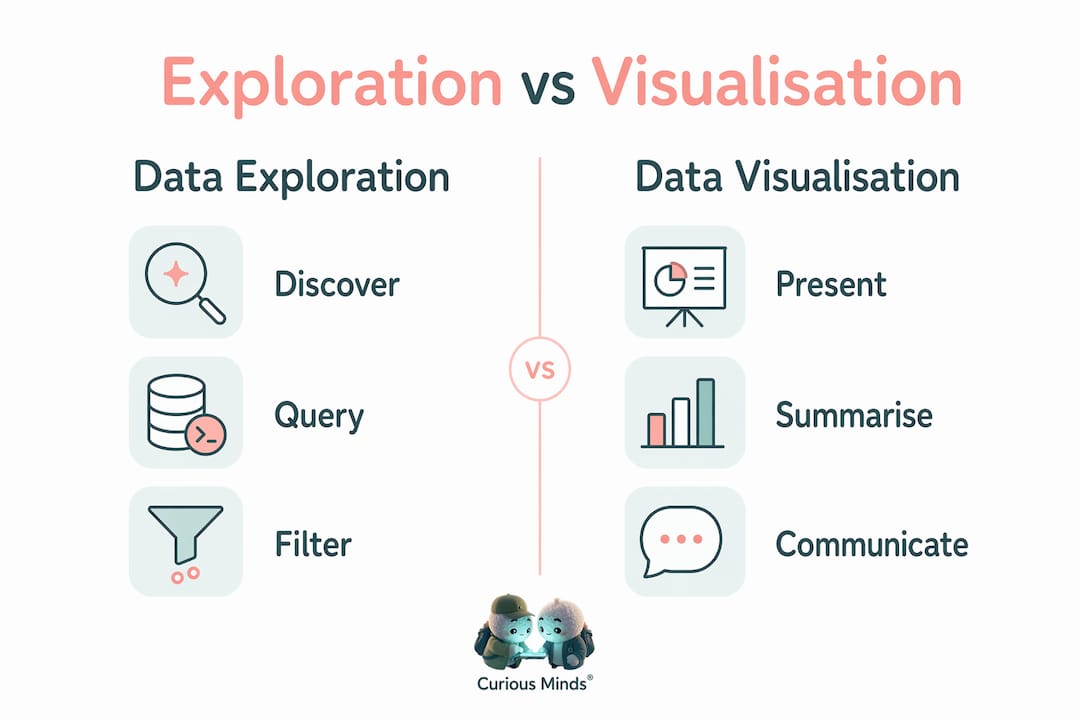
Many researchers conflate the two categories. Visualisation tools are the final step. Exploration tools are the work that happens before you know what to visualise.
Types of physical exploration tools in geoscience
Physical exploration tools are instruments used to detect, measure, and map subsurface or surface phenomena in geological and environmental surveys. They range from airborne sensors to ground-level chemical sampling kits. The goal is identical to data exploration: reduce uncertainty about what lies beneath or beyond direct observation.
Remote sensing is the most widely deployed category. NASA's AVIRIS sensor uses reflected sunlight and spectral fingerprinting to identify minerals and chemicals across large survey areas. The AVIRIS-5 instrument, deployed on NASA's ER-2 aircraft, completed 26 flights for mineral mapping in California's high desert, helping geologists locate critical mineral sources without excavating every site. That scale of coverage would be impossible with ground teams alone.
Geochemical sampling tools measure soil composition, gas concentrations, and water chemistry at specific locations. Multi-proxy approaches combine remote sensing data with soil-gas measurements to identify and validate anomalies exceeding 50 ppm above background levels. This integrated method prioritises the most promising mineral prospects before committing resources to expensive drilling programmes.
Pro Tip: Never rely on a single instrument type in geoscience surveys. Remote sensing identifies candidate zones. Ground-truth measurements confirm them. Using both cuts false-positive rates significantly.
Common physical exploration tool types and their functions
| Tool type | Domain | Primary function |
|---|---|---|
| AVIRIS spectral sensor | Remote sensing | Mineral and chemical identification via spectral imaging |
| Soil-gas sampler | Geochemistry | Measures hydrogen and other gas concentrations in soil |
| Ground-penetrating radar | Geophysics | Maps subsurface structures without excavation |
| Magnetometer | Geophysics | Detects magnetic anomalies linked to ore deposits |
| Portable XRF analyser | Geochemistry | On-site elemental analysis of rock and soil samples |
Physical exploration tools increasingly feed data into digital platforms. A geologist using AVIRIS generates spectral datasets that require the same filtering and anomaly-detection workflows as any business intelligence query. The two domains are converging.
How to use exploration tools effectively for market analysis
Effective use of exploration tools follows an iterative cycle, not a linear path. You do not start with answers. You start with questions, and the tool helps you refine them. This applies whether you are analysing consumer trend data or scanning satellite imagery for mineral deposits.
The following workflow applies directly to market analysis and trend discovery:
- Define your initial question. Be specific. "Which product categories are growing in Southeast Asia?" is a workable starting point. "What is happening in markets?" is not.
- Profile the data first. Before filtering, understand what you have. Check distributions, missing values, and outliers. Effective exploration tools support this profiling step before any hypothesis testing begins.
- Discover the schema. In enterprise analytics, schema discovery prevents error-prone guesswork about data structures. Know your tables, fields, and relationships before writing a single query.
- Run focused queries. Narrow your scope. Broad queries return noise. Tight queries return signal. Microsoft Sentinel's MCP architecture enforces this discipline by design.
- Test your hypothesis. If the data contradicts your assumption, revise the assumption. This is the step most analysts skip, and it is where the real insight lives.
- Save and trace your work. dbt Insights stores query history and saved results so findings are auditable and reusable. Reproducibility is not optional in serious research.
- Connect outputs to reporting. Exploration findings feed visualisation. Export your validated insights into a dashboard or report only after the investigation is complete.
A common pitfall is treating exploration as a one-pass activity. Researchers who run a single query and accept the result miss the iterative nature of the process. The best exploration tools for research are designed to reward repeated questioning, not single lookups.
Pro Tip: Keep a query log even when your tool does not enforce one. Noting what you searched, what you found, and what you ruled out creates an audit trail that strengthens any research conclusion.
Data-focused vs geoscience-focused exploration tools: a comparison
The two categories of exploration tools share a philosophy but differ sharply in execution. Understanding those differences helps researchers and analysts choose the right instrument for their specific problem.
| Dimension | Data exploration tools | Physical exploration tools |
|---|---|---|
| Domain | Business intelligence, analytics, security | Geology, mineral prospecting, environmental science |
| Primary input | Structured or semi-structured datasets | Physical measurements, sensor readings, imagery |
| Interactivity | High: real-time querying and filtering | Low to medium: field collection then lab analysis |
| Key output | Patterns, anomalies, validated hypotheses | Prospect maps, anomaly zones, resource estimates |
| Leading examples | Domo, Microsoft Sentinel, dbt Insights | AVIRIS, magnetometers, portable XRF analysers |
| Integration trend | AI-assisted query generation | Multi-proxy sensor fusion |
The most significant overlap is in the validation step. Both domains require multi-source confirmation before drawing conclusions. A data analyst cross-references multiple datasets. A geologist cross-references remote sensing with ground samples. The logic is identical. The instruments differ.
Digital and physical exploration tools are also converging. Geoscience platforms now ingest AVIRIS spectral data into analytics environments where analysts apply the same filtering and anomaly-detection methods used in business intelligence. Researchers who understand both domains hold a genuine advantage in fields like environmental monitoring, resource economics, and AI-driven trend discovery.
Key takeaways
Exploration tools are investigative instruments that reduce uncertainty through iterative, structured inquiry across both digital and physical domains.
| Point | Details |
|---|---|
| Definition is dual | Exploration tools cover both data analytics software and physical geoscience instruments. |
| Exploration is not visualisation | Data exploration tools discover unknown patterns; visualisation tools present known findings. |
| Schema discovery saves time | Retrieving data structure before querying prevents wasted effort and reduces errors. |
| Multi-proxy validation is standard | Both data and geoscience exploration require cross-source confirmation before conclusions. |
| Reproducibility is non-negotiable | Query history and saved results, as in dbt Insights, make findings auditable and reusable. |
Why exploration tools are misunderstood more than any other category
The most persistent misconception I encounter is that exploration tools and dashboards are the same thing. They are not, and conflating them leads to genuinely poor decisions. A dashboard tells you what you already decided to measure. An exploration tool tells you what you did not know to look for. That gap is where competitive advantage lives.
What strikes me most, after working with both data and geoscience contexts, is how rarely researchers treat exploration as a discipline in its own right. Most teams treat it as a preliminary step before the "real" analysis. That framing is backwards. The exploration phase is where the most consequential decisions are made: which variables matter, which anomalies are worth pursuing, which hypotheses survive contact with actual data.
The integration challenge is real and underappreciated. Connecting AVIRIS spectral outputs to a business intelligence platform, or feeding market signal data into a geochemical workflow, requires researchers who understand both the instrument and the analytical environment. AI is beginning to close that gap, with tools like Microsoft Sentinel's MCP using natural language to lower the barrier to schema discovery and query execution. But AI assistance does not replace the critical mindset. It accelerates it.
My recommendation is straightforward. Treat every exploration session as a formal investigation. Define your question before you open the tool. Document what you ruled out, not just what you found. And resist the urge to stop at the first plausible answer. The second or third iteration is usually where the genuinely useful insight appears.
— Aidil
Ontherice and AI-powered market exploration
Ontherice applies multiple AI engines to scan global data points, extract signals from noisy markets, and surface what is gaining momentum before it reaches mainstream awareness. That process mirrors the iterative exploration workflow described throughout this article: profile, query, validate, repeat.

Researchers and analysts who want to apply exploration principles to live market data can access Ontherice's AI-driven opportunities page, which surfaces ranked signals across sectors in real time. The platform's AI tools suite supports the kind of structured, repeatable investigation that separates genuine market insight from surface-level trend watching. If you are serious about reducing uncertainty in your analysis, the infrastructure is already built.
FAQ
What are exploration tools used for?
Exploration tools are used to discover unknown patterns, validate hypotheses, and reduce uncertainty through iterative investigation. They apply across data analytics, market intelligence, and geoscience.
What is the difference between data exploration and data visualisation?
Data exploration discovers unknown insights through active querying and filtering. Data visualisation presents findings that are already known, typically in charts or dashboards.
What are the best exploration tools for market research?
Domo, Microsoft Sentinel, and dbt Insights are leading data exploration tools for market research. Each supports iterative querying, schema discovery, and reproducible findings.
How do physical exploration tools differ from digital ones?
Physical tools such as AVIRIS sensors and portable XRF analysers collect measurements from the real world. Digital tools query structured datasets. Both use iterative, multi-source validation to confirm findings.
Why is schema discovery important in data exploration?
Schema discovery reveals the structure of a dataset before querying begins. Microsoft Sentinel's workflow prioritises this step to prevent errors and speed up focused investigation.