

The most effective way to monitor industry trends is a repeatable workflow that combines targeted signal scoping, continuous data capture from official UK sources, AI-assisted analysis, and short validation experiments before committing resources. For UK professionals, that means anchoring your stack on the Office for National Statistics, Companies House, and Google Trends, then layering in social listening and predictive platforms to catch signals before they reach the mainstream.
The single best approach: scope narrowly, automate collection, validate with a small pilot, then measure the outcome against a clear baseline.
Top methods at a glance:
- Official UK datasets: ONS quarterly releases, Companies House filings, regulatory consultations
- Web scraping for pricing, hiring, and product launch signals
- Social listening and forum monitoring (Reddit, specialist communities)
- Google Trends for search-demand shifts
- Expert networks and trade association briefings
- Predictive analytics platforms with AI-assisted signal scoring
Key takeaways
A repeatable, scoped monitoring workflow that combines UK primary sources, automated collection, AI-assisted scoring, and short validation pilots is the most reliable way to turn industry signals into strategic decisions.
| Point | Details |
|---|---|
| Scope before you collect | Define five signal domains maximum before building any alerts or feeds. |
| Anchor on UK primary sources | ONS, Companies House, and regulatory filings provide the baseline every other signal should be checked against. |
| Validate with three sources | Escalate a signal only when at least three independent sources corroborate it. |
| Run small pilots fast | Score signals on impact × likelihood × lead time; pilot high-scoring signals within four to six weeks. |
| Ontherice accelerates the workflow | The platform delivers scored, sourced signal cards and live AI interrogation, cutting manual triage time significantly. |
Table of Contents
- What does a repeatable trend-monitoring workflow look like?
- How do you capture live signals with practical tools?
- How does AI help you turn raw signals into usable intelligence?
- How do you validate signals and avoid chasing noise?
- How do you turn validated trends into decisions and pilots?
- What KPIs should you track to prove monitoring delivers results?
- Your monitoring cadence and daily checklist
- What the process taught me about building a monitoring system
- Ontherice gives you a faster path to early signals
- Sources
What does a repeatable trend-monitoring workflow look like?
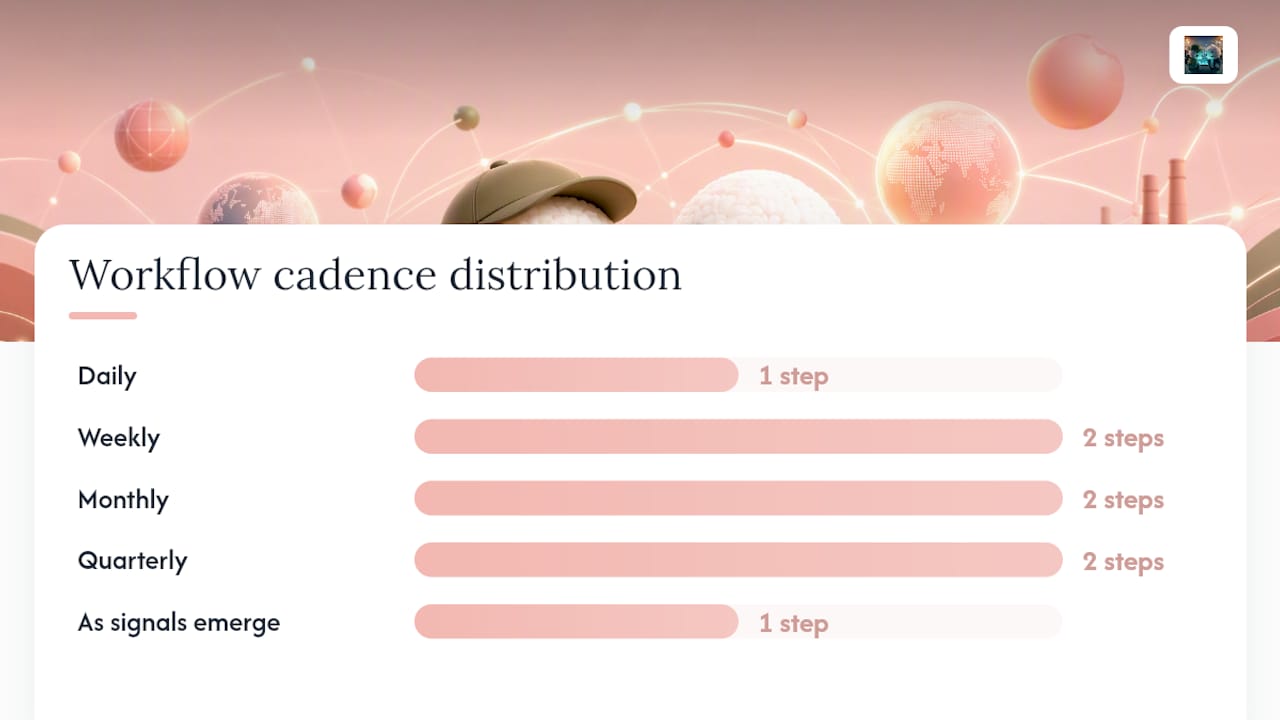
A six-step cycle keeps the process manageable and delegable. Run it at the cadences below and you will rarely be surprised by a market shift.
- Scope (quarterly): Define which signals matter. Pick three to five domains — pricing, hiring, regulation, consumer sentiment, adjacent technology. Narrow scope cuts noise faster than any filter.
- Collect (daily/weekly): Automate data capture from your chosen sources. Daily for social, news, and reviews; weekly for job postings and website changes.
- Analyse (weekly): Cluster signals by theme. Flag velocity changes — a sudden spike in job postings in a competitor sector is a signal worth noting.
- Validate (as signals emerge): Apply the rule of three: at least three independent sources must corroborate a signal before it escalates. MIT Sloan recommends running rapid, low-cost experiments rather than waiting for statistical certainty.
- Decide (monthly): Route validated signals to the right owner — product lead, commercial director, or executive team — with a clear go/no-go recommendation.
- Measure (monthly/quarterly): Track whether actions taken on signals produced the expected outcome. Without this loop, monitoring becomes a reporting exercise rather than a decision tool.
Who owns what in a small team: the analyst runs steps 1–3; a data engineer or ops lead owns collection automation; the product or commercial lead owns validation and decision; the executive reviews outcomes quarterly.
Pro Tip: *Scope your monitoring to a maximum of five signal domains in the first 90 days.
How do you capture live signals with practical tools?
Web scraping automates continuous collection of pricing changes, product launches, hiring signals, review sentiment, and SERP visibility shifts, then normalises them into structured datasets you can feed into a dashboard or LLM summarisation tool for a weekly brief.
Live channels to monitor:
- Google Trends — search-demand shifts are often the earliest public signal of a category change. Set comparison queries for your core market and adjacent sectors.
- Social listening — track brand mentions, product category terms, and competitor names across X, LinkedIn, and Reddit. MentionDrop recommends routing high-relevance mentions to Slack within a 48–72-hour window.
- Job postings — a company hiring ten ML engineers signals a product pivot six months before the announcement.
- Review platforms — sentiment shifts on Trustpilot or G2 flag product or service problems before they become public crises.
- RSS and curated newsletters — pipe key trade publications into a single reader; review weekly.
- Industry forums and Reddit — most trend signals first appear here, often weeks before trade press picks them up.
Pro Tip: Set relevance thresholds before you build alerts. A keyword alert with no minimum engagement filter will flood your inbox. Start with a threshold of 50+ engagements or three independent mentions within 48 hours before a signal reaches your digest.
For content-driven signals and share-of-voice tracking, content trend platforms add a useful layer on top of raw social data.
How does AI help you turn raw signals into usable intelligence?
AI platforms handle the parts of monitoring that break human analysts: aggregation across dozens of sources, normalisation into a common schema, clustering of related signals, and sentiment scoring at scale. The output is a ranked, scored feed rather than a raw data dump.
Practical uses include:
- Executive daily brief — a short digest of the top five signals by sector, scored by velocity and sentiment shift.
- Early signal cards — a single-screen summary of an emerging trend, its source corroboration, and a confidence score.
- Sector rankings — relative momentum scores across industries, updated in near real-time.
Ontherice does exactly this: it scans global public data, applies multiple AI engines to extract meaningful signals, and presents transparent sector rankings alongside live AI interrogation. A professional can query the platform directly — "what is driving the uptick in UK fintech hiring signals this week?" — and receive a structured, sourced answer rather than a list of raw links. That live interrogation feature is what separates a signal platform from a dashboard. For a deeper look at AI-driven early trend discovery, the Ontherice blog covers practical integration steps.
How do you validate signals and avoid chasing noise?
Validation checklist:
- Source corroboration — does the signal appear in at least three independent sources? A single Reddit thread is not a trend.
- Signal clustering — are related signals appearing simultaneously (e.g. hiring + investment + search demand all rising in the same category)?
- Magnitude check — is the change material relative to the baseline, or within normal variance?
- Velocity check — is the rate of change accelerating? A slow, steady rise is different from a sudden spike.
- Origin credibility — is the source a practitioner forum, a regulatory body, or an anonymous account? Weight accordingly.
Treat these as triggers for investigation, not confirmation.
Pro Tip: Before escalating a weak signal to the executive team, run a 48-hour partner or customer pulse check. Three informal conversations with customers or channel partners will tell you whether the signal is real faster than any dashboard.
MIT Sloan's "zoom lens" approach — scanning adjacent industries for weak signals and validating with rapid experiments — is the most practical framework for avoiding false positives without slowing decision-making.
How do you turn validated trends into decisions and pilots?
Score each validated signal on three dimensions: impact (revenue or risk exposure if the trend materialises), likelihood (confidence based on corroboration), and lead time (how long before the trend becomes mainstream). Multiply the three scores on a 1–5 scale. Signals with a high combined score warrant a pilot; lower scores should be monitored only.
Pilot checklist:
- Define a single measurable objective (e.g. "test whether customers will pay a premium for X feature").
- Set a minimal viable experiment: the smallest test that produces a usable result.
- Fix a duration: four to six weeks for most commercial pilots.
- Agree success criteria before you start, not after.
- Assign a named owner and a budget ceiling.
Decision gates keep pilots from drifting. Small, rapid pilots beat large bets on unvalidated signals every time. For practical methods on turning signals into market opportunities, the Ontherice blog covers the full prioritisation process.
What KPIs should you track to prove monitoring delivers results?
Separate your metrics into three layers:
Input metrics (are you running the process?):
- Signals detected per week by domain
- Sources monitored (active vs. configured)
Process metrics (is the process working?):
- Validated signals per month
- Time from signal detection to validated decision
- Pilots initiated per quarter
Outcome metrics (is it creating value?):
- Revenue influenced by trend-led initiatives
- Cost avoided through early regulatory or competitive awareness
- Time-to-decision reduction versus previous baseline
| Metric | Type | Target cadence |
|---|---|---|
| Signals detected | Input | Weekly |
| Validated signals | Process | Monthly |
| Pilots initiated | Process | Quarterly |
| Revenue influenced | Outcome | Quarterly |
| Time-to-decision | Outcome | Monthly |
For monthly executive review, a one-page report works best: list the top three validated signals, the pilot status for each, and the outcome metric movement. Attribution is the hard part — agree upfront which revenue lines or cost centres a trend-led initiative can claim credit for, and document the baseline before the pilot starts.
Your monitoring cadence and daily checklist
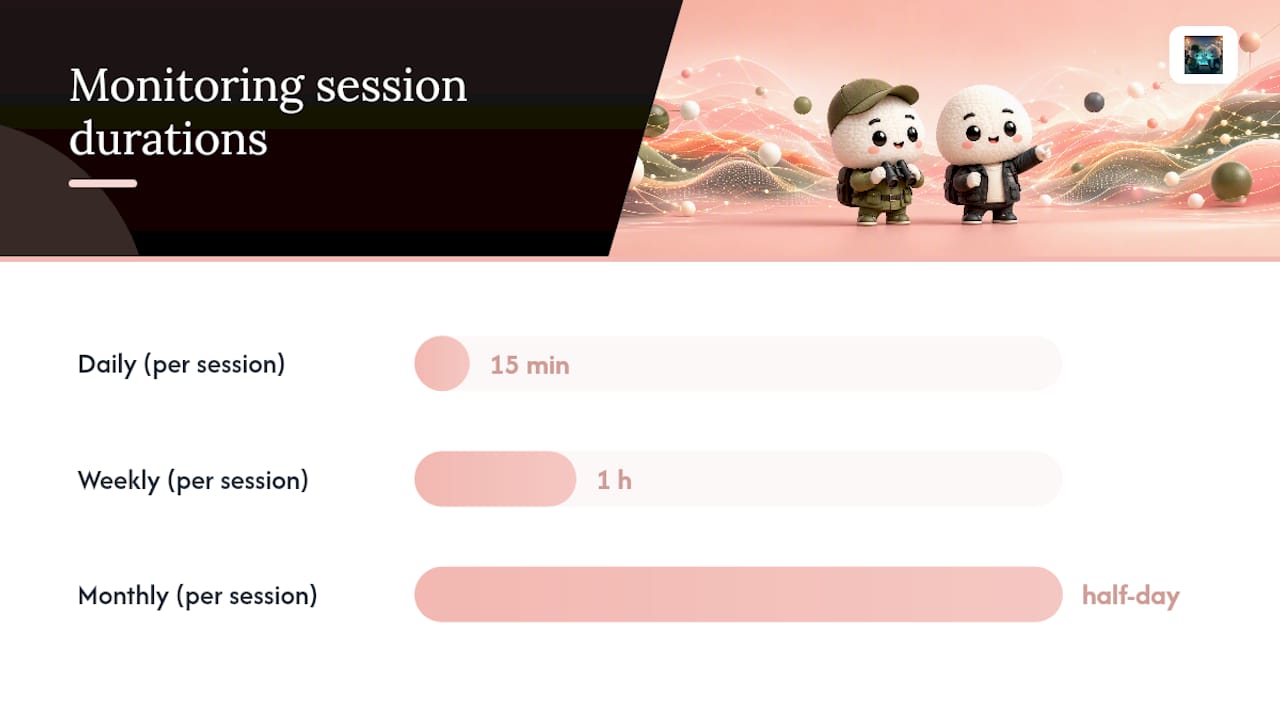
Daily (15 minutes):
- Review social and news alerts for your five tracked domains.
- Check for regulatory announcements on GOV.UK.
- Flag anything that meets your relevance threshold to the weekly digest.
Weekly (1 hour):
- Review job posting changes for key competitors and adjacent sectors.
- Check Google Trends for search-demand shifts in your category.
- Compile the weekly signal digest and distribute to the team.
- Review website change alerts for key market players.
Monthly (half-day):
- Pull ONS and Companies House data for your sector.
- Run a deep-dive analysis on the top three signals from the month.
- Update sector rankings and share with the executive team.
- Review pilot outcomes and update the scoring model.
| Source type | Refresh cadence | Owner |
|---|---|---|
| Social and news | Daily | Analyst |
| Job postings and SERP | Weekly | Analyst / data engineer |
| Website change detection | Weekly | Data engineer |
| ONS and Companies House | Monthly | Analyst |
| Trade reports and Statista | Monthly / quarterly | Analyst |
| Regulatory consultations | As published | Compliance lead |
Pro Tip: Match your cadence to your market's pace. A fast-moving sector like fintech warrants daily social monitoring; a slow-moving industrial sector may only need weekly. Over-monitoring a slow market creates noise and erodes team trust in the process.
What the process taught me about building a monitoring system
Most teams start with too many sources and too little structure. The instinct is to capture everything — every news feed, every social channel, every report — and then wonder why the weekly digest runs to forty pages nobody reads.
The lesson that took longest to learn: scope is a strategic decision, not a technical one. Deciding what not to monitor is harder than adding another data source, and it matters more. When we built Ontherice, the temptation was to surface every signal across every domain simultaneously. What actually worked was starting with five sectors, validating the signal quality, and expanding only when the process was stable.
Three things that hold up in practice. First, validate fast and cheaply — a 48-hour customer pulse check beats a three-week analysis. Second, transparency in how a signal is scored matters as much as the score itself; analysts who cannot explain why a signal ranked highly will not act on it. Third, the feedback loop is where most programmes fail. If you do not close the loop between action and outcome, the monitoring system gradually drifts from the business's actual decisions.
Signal identification done well is less about technology and more about discipline: the right scope, the right cadence, and the willingness to kill a pilot that is not working.
Ontherice gives you a faster path to early signals
Most professionals reading this will recognise the bottleneck: the workflow is sound, but building and maintaining the data infrastructure takes time most teams do not have. Ontherice removes that bottleneck.

The platform aggregates signals across finance, technology, jobs, brands, and more, scores them in real time, and presents transparent sector rankings you can interrogate directly with live AI queries. No raw data dumps, no manual triage. You get a scored, sourced signal card and the ability to ask follow-up questions in plain language. For teams that want to go deeper, the AI Opportunities feed surfaces premium early-signal packs by sector, and the Ontherice Whitepaper walks through the methodology in detail. Start by connecting your priority sectors, reviewing the first week's signal digest, and running one pilot against the top-ranked signal. That 30-day test is the fastest way to see whether the platform fits your decision cycle.
Sources
- How to read and respond to weak digital signals (MIT Sloan)