
The highest-impact data-driven strategies available to UK organisations right now are not the most technically complex ones. They are the ones that connect a clear business question to a measurable outcome quickly. Here are the eight worth testing first:
- Strategic data core (proprietary corpus + external pipeline + agent-driven cleaning): builds a compounding asset competitors cannot copy. First test: audit what unique internal data you hold that no vendor can replicate.
- Behavioural triggers and attribute-based segmentation: Customer these two tactics account for the highest personalisation ROI in 2026. First test: set up one trigger-based email sequence on a high-traffic conversion step.
- Predictive and prescriptive models: move decisions from reactive to anticipatory. First test: run a 90-day churn-prediction pilot on your top customer segment.
- Metrics layer: a single semantic layer that gives every team the same definitions. First test: define five business metrics in one shared tool and retire the conflicting spreadsheets.
- Data clean rooms: privacy-safe collaboration with partners without exposing raw records. First test: scope a clean-room pilot with one retail or media partner.
- Continuous experimentation (A/B and multivariate): replaces opinion with evidence at every decision point. First test: run one controlled experiment on a pricing or UX decision this quarter.
- Automated data quality monitoring: catches errors before they corrupt models. First test: deploy an observability tool on your three most-used data pipelines.
- Model-error flywheel: IMD argues that capturing model failures as a deliberate fourth data source creates a self-improving AI advantage. First test: log every model prediction and its actual outcome for 30 days.
Pick two or three from this list, not all eight. The organisations that move fastest are the ones that resist the urge to do everything at once.
Key takeaways
The highest-impact data-driven strategies are the ones that connect a specific business question to a measurable outcome within 90–180 days, supported by a metrics layer, clean data, and a named owner.
| Point | Details |
|---|---|
| Pick one pilot first | Choose the use case at the intersection of high ROI and accessible data; resist running multiple pilots simultaneously. |
| Build the metrics layer early | Define shared business metrics before training any model; definitional conflicts kill more pilots than poor model accuracy. |
| Capture model errors deliberately | Log every wrong prediction and feed it back into training; this is the model-error flywheel that compounds over time. |
| Govern before you scale | Complete a DPIA and document lawful basis for personal data before deploying any model that affects individuals under UK GDPR. |
| Ontherice for external signals | Use Ontherice's signal feeds to validate internal hypotheses and detect market shifts before they appear in your own data. |
Table of Contents
- What does a data-driven strategy actually mean for your organisation?
- Core components every data-driven strategy must include
- What business outcomes should you expect, and when?
- How to run your first pilot: a 90–180 day roadmap
- Which technology categories power these strategies?
- Common traps leaders hit and how to avoid them
- The strategic data core and the cultural shifts that make strategies stick
- Real-world wins: what the evidence actually shows
- How leaders should prioritise and fund data strategy work
- External signal platforms can sharpen your internal data strategy
- Sources
What does a data-driven strategy actually mean for your organisation?
A data-driven strategy is an organisation-wide operating model in which decisions at every level, from board to frontline, are shaped by evidence drawn from structured data rather than instinct alone. That definition matters because it separates a genuine strategy from a collection of isolated analytics projects. One-off dashboards and ad hoc reports are not a strategy; they are symptoms of the absence of one.
McKinsey identifies three mutually supportive capabilities that organisations need to exploit analytics successfully: the ability to identify and combine multiple data sources, the ability to build predictive and optimisation models, and the organisational muscle to transform how managers actually use those models. All three must exist together. Strong models sitting inside a team that leadership ignores deliver nothing.
This article covers the strategies most relevant to UK organisations across finance, retail, and healthcare, the three sectors where data-driven decision making is generating the clearest, most measurable returns. What it does not cover: deep vendor how-tos, raw data engineering tutorials, or academic treatments of statistical theory.
Scope at a glance:
- Industries: financial services, retail and consumer goods, healthcare and life sciences
- Problems addressed: slow decisions, poor personalisation, operational waste, compliance risk, forecast inaccuracy
- Not covered: vendor implementation guides, data science fundamentals, infrastructure procurement
Gartner's guidance on analytics strategy consistently emphasises that analytics must be embedded into daily workflows, not bolted on as a reporting afterthought. GDPR, enforced in the UK through the UK GDPR and the Data Protection Act 2018, adds a compliance dimension that shapes how data is collected, stored, and used, making governance a strategic requirement rather than a legal checkbox.
Core components every data-driven strategy must include
Before any advanced tactic makes sense, six foundational components need to be in place. Think of them as the infrastructure that separates a strategy from a project.
Data collection and integration Every relevant source, CRM, ERP, web analytics, third-party feeds, must flow into a unified layer. The 30-day action: map every data source and identify the three with the highest decision value that are not yet integrated.

Governance and quality Data governance defines who owns each dataset, what quality standards apply, and how lineage is tracked. Poor governance is the single most common reason pilots fail to scale. Spot it by asking: "Can anyone in this organisation tell me where this number came from?" If the answer is uncertain, governance is immature. The 60-day action: appoint a data steward for each critical domain and publish a one-page data dictionary.
Storage and accessibility A modern data warehouse or lakehouse (Snowflake, Databricks, and BigQuery are widely used in the UK) gives teams a single source of truth. Accessibility matters as much as storage: if analysts need to raise a ticket to query a table, the architecture is working against the strategy. The 30-day action: audit query latency and access request volumes.
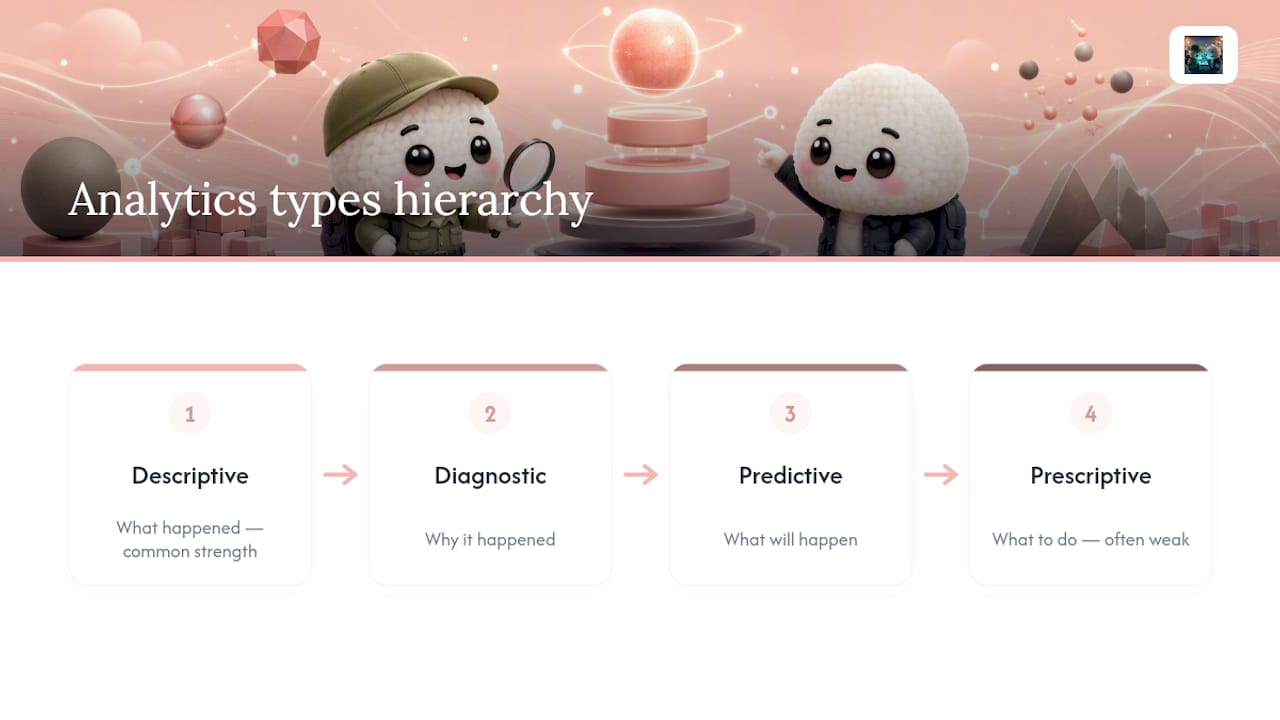
Analysis and insight generation Coursera's overview of data-driven decision making identifies four analytics types that build on each other: descriptive (what happened), diagnostic (why it happened), predictive (what will happen), and prescriptive (what to do about it). Most organisations are strong on descriptive and weak on prescriptive. The 90-day action: identify one decision currently made on gut feel and build a prescriptive model for it.
Operationalisation of insights Striim's framework for data-driven strategy makes the point plainly: analytical systems must reflect live operational reality. Change data capture (CDC) and streaming pipelines are the mechanisms that close the gap between when something happens and when the model knows about it. The 90-day action: identify the highest-latency data feed in your stack and replace batch ingestion with streaming.
Measurement and optimisation Every strategy needs a before/after measurement framework. Without it, you cannot distinguish a genuine improvement from noise. The 30-day action: define the three KPIs that will determine whether the first pilot succeeded, and record their baseline values today.
Pro Tip: Treat model errors as a deliberate data source, not a failure to hide. Every time a predictive model gets a prediction wrong, that error contains signal about what the model does not yet know. Log it, label it, and feed it back into training. IMD calls this the model-error flywheel, and it is one of the few data assets that genuinely compounds over time.
What business outcomes should you expect, and when?
Data-driven decision making delivers across four outcome categories: operational efficiency, revenue growth, risk reduction, and faster decisions. The honest answer on timing is that most pilots show directional signal within 90 days and measurable ROI within 6–12 months. Expecting transformation in 30 days is how pilots get cancelled prematurely.
Marketing personalisation (retail, financial services) Behavioural trigger campaigns, where a message fires based on a specific user action rather than a calendar schedule, consistently outperform batch sends. According to Customer.io, attribute-based segmentation accounts for 31% of personalisation ROI and behavioural triggers for 29%. For a mid-size UK retailer, a 90-day pilot targeting abandoned-basket triggers typically moves conversion rate by several percentage points. KPI: email-attributed revenue per recipient.
Operations optimisation (logistics, manufacturing) Predictive maintenance models reduce unplanned downtime by flagging equipment failure before it occurs. The KPI is mean time between failures (MTBF) and the cost of emergency maintenance as a percentage of total maintenance spend. Timeline: 90–180 days to collect enough sensor data for a reliable model.

Fraud detection (financial services) Real-time transaction scoring, powered by streaming pipelines and anomaly detection models, reduces fraud losses and false-positive rates simultaneously. UK financial services firms operating under FCA oversight have a regulatory incentive to invest here beyond pure ROI. KPI: fraud loss rate and false-positive rate.
Customer retention (SaaS, telecoms, utilities) Churn prediction models identify at-risk customers 30–60 days before they leave, giving retention teams time to intervene. KPI: 90-day churn rate among the at-risk cohort versus a control group.
Illustrative signals from well-known organisations:
- Netflix uses viewing behaviour data to personalise thumbnails and recommendations at the individual level, reducing subscriber churn. The lesson for UK media and subscription businesses: the personalisation signal is already in your event logs.
- Uber applies dynamic pricing models that balance supply and demand in real time. The lesson: operational data, when modelled correctly, becomes a pricing and capacity lever.
- Starbucks uses its loyalty programme data to drive personalised offers through its mobile app, connecting purchase history to individual promotions. The lesson: a loyalty scheme without a data strategy is a cost centre; with one, it is a growth engine.
- Coca-Cola applies data analytics to optimise vending machine restocking and product mix by location. The lesson: even physical distribution decisions benefit from predictive models when the underlying data is clean and timely.
For more concrete examples with measurable outcomes, the Ontherice case library covers eight real-world data-driven initiatives across sectors.
How to run your first pilot: a 90–180 day roadmap
Start by picking a pilot that sits at the intersection of high ROI potential and operational feasibility. Valiotti's seven-step roadmap recommends sequencing investments by ROI first, then feasibility, and building the roadmap on a single page that can be reviewed quarterly. That discipline prevents the common failure mode of building a technically impressive system that nobody uses.
Choosing your first use case: ask two questions. First, which decision, if made faster or more accurately, would move a KPI that leadership already tracks? Second, do you have, or can you quickly access, the data needed to support that decision? The intersection of those two answers is your pilot.
KPI targets to set before you start:
- Time to first value: analyst can answer a new business question within 48 hours of data being available
- Model accuracy: predictive model outperforms the current heuristic by a meaningful margin on held-out test data
- Activation rate: percentage of intended users who query the new system at least once per week
- Forecast accuracy: mean absolute percentage error (MAPE) below the threshold agreed with the business owner
Cost bands (indicative, not fixed):
- Low (internal data, existing tools): £10,000–£50,000 for a 90-day pilot
- Medium (new tooling, external data): £50,000–£200,000
- High (new infrastructure, ML platform, external consultancy): £200,000+
Pilot greenlight checklist:
- Business question is specific and measurable
- Baseline KPI is recorded
- Data source is identified and accessible
- Executive sponsor is named and committed
- Success and stop criteria are agreed in writing
- GDPR and UK data protection obligations are reviewed for the data involved
- Timeline and budget are approved
Pro Tip: Build the metrics layer before the machine learning models. A shared semantic layer, where "active customer" means the same thing in every report, prevents the situation where the pilot succeeds by one team's definition and fails by another's. That definitional conflict kills more data initiatives than poor model performance.
Which technology categories power these strategies?
The technology stack for a data-driven strategy maps to the six components above. The categories below are the ones that matter most for UK organisations at the pilot-to-scale stage. Understanding how digital and data capabilities integrate with business operations is a useful starting point before evaluating specific tools.
Data warehouse / lakehouse Stores structured and semi-structured data at scale. Cloud-based options are widely available in the UK with data residency in UK or EU regions, which matters for UK GDPR compliance. Selection question: does the vendor offer UK or EU data residency as a default, not an add-on?
ETL / ELT and change data capture (CDC) Moves data from source systems into the warehouse. CDC specifically captures row-level changes in real time, which is what makes streaming analytics possible. Selection question: does the tool support both batch and streaming without requiring two separate pipelines?
Metrics layer A semantic layer that sits between the warehouse and BI tools, defining business metrics once and exposing them consistently. This is the component most organisations skip and most regret skipping. Selection question: can a non-technical business analyst define and publish a new metric without engineering support?
Analytics and BI Dashboards, self-service reporting, and ad hoc querying. The maturity signal here is not the sophistication of the charts but whether frontline managers actually use the tool daily. Selection question: what is the weekly active user rate among non-technical staff?
MLOps platform Manages the lifecycle of machine learning models: training, versioning, deployment, monitoring, and retraining. Without MLOps, models degrade silently as the world changes. Selection question: does the platform alert you when model performance drops below a defined threshold?
Experimentation platform Runs controlled A/B and multivariate tests with statistical rigour. Selection question: does the platform handle novelty effects and correct for multiple comparisons automatically?
Data clean rooms Privacy-preserving environments where two organisations can run joint analyses without either party seeing the other's raw data. Increasingly relevant for UK retail media and financial services partnerships. Selection question: is the clean room compliant with UK GDPR and ICO guidance on data sharing?
Observability and data quality Monitors pipelines for anomalies, schema changes, and freshness issues. Think of it as uptime monitoring for your data. Selection question: how quickly does the tool alert you when a critical table stops updating?
Pro Tip: When evaluating any tool in this stack, ask the vendor for a reference customer in a UK-regulated industry. Compliance with UK GDPR, FCA data rules, or NHS data standards is not something to discover post-procurement.
Common traps leaders hit and how to avoid them
The three most common failure modes are: starting with technology instead of a business question, underestimating the culture change required, and tolerating poor data quality for too long. Each is avoidable.
| Trap | Red flags | Immediate mitigation |
|---|---|---|
| Tech-first thinking | Procurement before problem definition; "we need a data lake" without a use case | Start with the business question; let the question determine the stack |
| Culture mismatch | Managers override model recommendations without logging why; analytics team isolated from business units | Embed analysts in business teams; make model overrides a data point, not a veto |
| Poor data quality | Dashboards show different numbers for the same metric; analysts spend most of their time cleaning | Appoint data stewards; implement automated quality checks before any model training |
| Talent gaps | No data engineers; analysts doing engineering work; no ML expertise for predictive pilots | Hire or contract one senior data engineer before building; use managed ML services to reduce expertise dependency |
| Governance failures | No data ownership; GDPR obligations unclear; no lineage tracking | Run a data audit; map personal data flows; register with the ICO if not already done |
| Change management neglect | Low adoption of new tools; business teams revert to spreadsheets | Involve end users in design; measure and report adoption as a KPI alongside accuracy |
UK-specific governance considerations:
The UK GDPR and the Data Protection Act 2018 require that personal data used in models is processed lawfully, fairly, and transparently. For predictive models that affect individuals (credit scoring, health risk stratification, targeted marketing), organisations must be able to explain the basis for automated decisions. The ICO's guidance on AI and data protection is the primary reference. Practically, this means:
- Document the lawful basis for every personal data source used in a model
- Conduct a Data Protection Impact Assessment (DPIA) before deploying any model that processes personal data at scale
- Build explainability into model selection, not as an afterthought
Gartner's analytics strategy guidance reinforces that leadership alignment is as important as technical compliance: managers who do not trust models will not use them, making governance a cultural problem as much as a legal one.
Morrisons, as one example of a large UK retailer navigating these tensions, has had to balance the commercial value of customer data with the reputational and legal obligations that come with processing it at scale. The lesson for any UK organisation: data governance is not a constraint on strategy; it is a precondition for it.
The strategic data core and the cultural shifts that make strategies stick
The most defensible competitive advantage from data is not a better dashboard or a faster model. It is a proprietary data asset that compounds over time and that competitors cannot replicate by buying the same software.
IMD's research on data strategy defines this as the strategic data core: a proprietary corpus of internal knowledge, an external-enriching pipeline that brings in market signals, agents that keep the data clean and current, and a model-error feedback loop that turns every wrong prediction into a training signal. The four moves IMD recommends are building the corpus, building the pipeline, deploying agents, and capturing model errors deliberately.
McKinsey's three capabilities sit alongside this: combining multiple data sources, building predictive and optimisation models, and transforming managerial behaviour so that models are actually used. The cultural shift is the hardest part. Most leaders underestimate that data strategy is an asset-building exercise, not a technology project. The technology is replaceable; the proprietary corpus is not.
The scale of data being generated globally, tracked by Statista's data creation statistics, makes governance and observability investments more urgent each year. Organisations that do not build the infrastructure to manage data quality at scale will find their models degrading faster than they can retrain them.
Two implementation pro-tips for embedding this into an enterprise roadmap:
- Build a knowledge graph that connects your internal corpus to external signals. This is what makes the pipeline component of the strategic data core genuinely useful: structured relationships between entities (customers, products, markets) allow models to reason across domains, not just within them. Merging external market signals with internal data is a practical starting point for teams building this layer.
- Use data clean rooms to enrich the corpus with partner data without violating UK GDPR. Clean rooms allow two organisations to compute joint statistics on combined datasets without either party seeing the other's raw records. For UK retail, financial services, and healthcare, this is the privacy-safe path to richer training data.
AI integration strategies for executives offer a useful framework for embedding these capabilities into existing enterprise governance structures without requiring a full technology overhaul.
Real-world wins: what the evidence actually shows
The following examples are drawn from publicly documented initiatives. Each illustrates a specific strategy from this article and a measurable outcome.
-
Netflix and personalisation at scale: Netflix's recommendation engine and personalised thumbnail system are built on continuous behavioural data from hundreds of millions of viewing sessions. The outcome is reduced churn and increased session length. The lesson for UK subscription businesses: the data you need for personalisation is already being generated; the gap is usually in the pipeline and the model, not the raw events.
-
Uber and real-time operational modelling: Uber's surge pricing model processes supply and demand signals in real time to balance driver availability against rider demand. The lesson: streaming data pipelines are not a luxury for large tech companies. Any UK logistics or service business with variable demand can apply the same principle at a smaller scale.
-
Starbucks and loyalty-driven personalisation: Starbucks' loyalty programme generates individual-level purchase data that feeds personalised offers through its mobile app. The programme connects behavioural data to commercial outcomes at the individual customer level. The lesson: a loyalty scheme is a data collection mechanism first; the commercial value follows from what you do with the data.
-
Coca-Cola and distribution optimisation: Coca-Cola uses data analytics to optimise vending machine restocking schedules and product mix by location, reducing waste and improving availability. The lesson: predictive models applied to physical distribution can reduce operational cost while improving service levels, a combination that is directly relevant to UK grocery, logistics, and field service businesses.
For early-stage signal detection and trend tracking that complements these internal data strategies, external platforms can surface patterns that internal data alone would miss.
How leaders should prioritise and fund data strategy work
The single most important prioritisation rule is this: sequence pilots by ROI times feasibility, not by technical ambition. The most sophisticated model that requires 18 months of infrastructure work and delivers uncertain returns is a worse first bet than a simpler model that answers a question leadership already cares about and can be built in 90 days.
Three rules that hold across sectors and organisation sizes:
Rule 1: Assign a single owner. Every data initiative needs one named person who is accountable for the business outcome, not the technical output. A data engineer who owns the pipeline and a business analyst who owns the dashboard is not the same as one person who owns the KPI. Diffuse ownership is how pilots stall.
Rule 2: Measure outcomes, not outputs. The number of dashboards built, models trained, or data sources integrated are outputs. The KPI improvement, the decision speed, the fraud loss reduction are outcomes. Report outcomes to the board, not outputs.
Rule 3: Build the metrics layer before the ML models. A shared semantic layer, where every team uses the same definition of "active customer" or "revenue," is the precondition for any model to be trusted. Without it, model outputs will be challenged on definitional grounds before they are ever evaluated on predictive accuracy.
On funding: most organisations do not need a large upfront capital commitment to start. A 90-day pilot with a focused business question, existing data, and a small cross-functional team (one data engineer, one analyst, one business owner) typically costs less than a mid-range enterprise software licence. The capital case for scaling comes from the pilot results, not from a business plan written before any data has been touched.
External signal platforms can sharpen your internal data strategy
Internal data tells you what your customers are doing. External signal platforms tell you what the market is about to do. The gap between those two perspectives is where early-mover advantage lives.

Ontherice is an AI-powered market intelligence platform that scans global public data to surface early trend signals across finance, technology, brands, and consumer markets. For organisations running data strategy pilots, it offers something internal data cannot: cross-market validation. When your internal churn model flags a shift in customer behaviour, an external signal feed can tell you whether that shift is idiosyncratic to your business or part of a broader market movement. That distinction changes the response.
The practical use case is straightforward: plug Ontherice's AI opportunity signals into the external-enriching pipeline component of your strategic data core. Use it to validate hypotheses before committing model-training resources, or to identify emerging segments before competitors do. For teams evaluating whether to build signal-detection capability in-house or buy access, the build option typically takes 12–18 months and requires specialist NLP and data engineering resource. Access to a live signal feed is available immediately.
Explore Ontherice's signal feeds to see which categories are most relevant to your current pilots.
Sources
The sources below underpin the claims in this article and are worth reading in full for deeper context.
- Your data strategy won’t create competitive advantage. These four moves will
- Customer
- Data-driven decision-making — Coursera