
TL;DR:
- Most companies underestimate how strongly network effects influence market trends and competitive advantage.
- Understanding how network effects grow, erode, or collapse is crucial for strategic analysis and platform building.
Most professionals underestimate how deeply network effects in market trends shape the companies they study and compete against. This is not about social media likes or app downloads. 73% of all digital value created since 1994 traces back to network effects, with the top five technology companies alone representing over £2.3 trillion in market capitalisation built on this single principle. If you are analysing markets, building platforms, or making strategic bets, understanding how network effects compound, erode, and occasionally collapse is one of the most consequential frameworks available to you.
Table of Contents
- Key takeaways
- How network effects shape markets and create moats
- Market dynamics shaped by network power
- The TikTok ban: when collective action overrides lock-in
- Graph Neural Networks and advanced market analytics
- Measuring and building network moats in practice
- My perspective on where network effects are heading
- Discover market signals before the crowd does
- FAQ
Key takeaways
| Point | Details |
|---|---|
| Network density beats raw growth | 1,000 engaged, interconnected users create stronger competitive moats than 10,000 passive ones. |
| Winner-take-most dynamics are real | Network effects drive compounding value that makes market incumbency durable and entry prohibitively costly. |
| Collective action can flip lock-in | The 2025 TikTok ban showed that coordinated user behaviour can overcome entrenched network effects. |
| AI analytics now map network behaviour | Graph Neural Networks achieve 94–95% accuracy predicting user behaviour across consumer-product networks. |
| Traditional effects are under pressure | AI and fragmented media consumption are eroding brand-based network effects across established categories. |
How network effects shape markets and create moats
A network effect exists when a product or service becomes more valuable as more people use it. That sounds simple. The mechanics are not.
Direct network effects occur when every new user adds value for all existing users. The telephone is the classic example. A messaging platform with ten million users is vastly more useful than one with ten thousand, not because the software changed, but because the network of reachable contacts grew. Indirect network effects operate differently. On a two-sided marketplace like a job board or a ride-hailing app, drivers make the platform better for riders, and riders make it better for drivers. Neither side benefits directly from the other side's presence, but the ecosystem compounds.
In B2B SaaS, network effects can be engineered beyond platform phenomena by designing structural dependencies that improve retention and pricing power, focusing on interaction quality rather than feature volume. This is a critical distinction. Many product teams confuse feature development with network strengthening. They are not the same.
The value of a network scales non-linearly. Metcalfe's Law suggests it scales with the square of the number of users. In practice, the scaling is less predictable but the direction is consistent: value compounds as connections multiply. This creates a structural advantage that most other business assets cannot match.
- Network density: the proportion of possible connections that are actually active and engaged, not just registered
- Cold-start vulnerability: new platforms struggle to offer value before reaching a critical user mass, making early traction the hardest phase
- Multi-homing rate: users who simultaneously use competing platforms signal weaker lock-in and more fragile network moats
- Organic acquisition: when existing users recruit new users without incentives, network effects are genuinely self-reinforcing
Pro Tip: Do not mistake viral growth for a network effect. Virality gets users through the door. A network effect is what makes them stay and what makes the product worse if they leave.
Network density and retention, not headline user counts, determine whether a platform has built a genuine moat or simply accumulated a large but fragile audience.
Market dynamics shaped by network power
When a platform achieves critical network density, something structurally significant happens. The cost of switching becomes prohibitive not because the product is technically superior, but because leaving means losing access to the network itself. This is the mechanism behind winner-take-most markets, and it explains why digital market leaders tend to hold their positions for far longer than leaders in traditional industries.
The feedback loop operates like this: more users attract more supply-side participants (in a marketplace) or more integrations (in SaaS), which increases utility, which attracts more users, which deepens the moat further. Market incumbency becomes durable because challengers must solve the cold-start problem while competing against an incumbent whose network already functions at scale.
"The companies most resistant to disruption are not those with the best technology or the lowest prices. They are those whose value is inseparable from the size and engagement of their user network."
This dynamic has significant policy implications. Regulators across Europe and the United States are increasingly focused on whether dominant digital platforms use network effects as a barrier to entry rather than simply as a reflection of genuine user preference. The distinction matters legally and strategically. For analysts, the question is not just whether a company has network effects, but whether those effects are creating value or primarily preventing competition.
AI and fragmented media consumption are adding a new layer of complexity. Traditional brand-based network effects, where widespread cultural awareness of a brand created social proof and adoption momentum, are weakening. Personalised media means a consumer might never encounter a brand's mass advertising campaign at all. Category ownership and precision positioning are replacing broad-based brand awareness as the dominant competitive mechanism.
The effects of social networks on trends are also shifting. Social platforms themselves still exhibit strong network effects, but the fragmentation of attention across more platforms means the concentration of network power is distributing slightly, even as individual platforms remain dominant within their categories.

The TikTok ban: when collective action overrides lock-in
The 2025 U.S. TikTok ban is one of the most instructive examples of network dynamics in business in recent memory, precisely because it demonstrated something analysts rarely model: the conditions under which entrenched network effects can be overcome.
Here is what happened in sequence:
- The U.S. government mandated that ByteDance divest TikTok or face a nationwide ban, citing national security concerns.
- The ban created a sudden, simultaneous disruption for millions of users rather than a gradual competitor-led challenge.
- Millions of TikTok users coordinated a mass migration to RedNote, a Chinese platform that had existed but lacked the network scale to compete under normal conditions.
- The coordinated exit flipped the network effect. RedNote reached a critical user mass almost overnight, not through organic growth or superior product features, but through collective action.
"The TikTok ban demonstrates that collective user action can flip network lock-in when the coordination problem is solved externally, in this case by government intervention creating a shared migration moment."
This matters for analysts and policymakers for a specific reason. The standard assumption in network effect theory is that users face a collective action problem: each individual prefers to stay on the dominant platform unless they believe others will leave simultaneously. The TikTok ban removed that uncertainty by forcing a shared decision point. Coordinated exit becomes a viable mechanism for competition policy when individual switching costs are prohibitive.
The implication is not that governments should routinely ban platforms. It is that the architecture of network lock-in is not permanent. When the coordination problem is solved, even the strongest network effects can unwind with remarkable speed. For strategists, this is a reminder that user relationships built on network dependency alone, without genuine product preference, are more fragile than they appear.
Graph Neural Networks and advanced market analytics
The most recent advance in understanding how network effects influence market trends comes not from economists but from machine learning researchers. Graph Neural Networks applied to consumer-product networks are producing predictive analytics that would have been computationally impossible five years ago.
The methodology involves representing consumers and products as nodes in a weighted bipartite network, where the connections between them encode purchasing history, frequency, and economic value. By incorporating temporal dynamics, the model captures how relationships evolve rather than treating behaviour as static.
| Method | Accuracy | Key benefit |
|---|---|---|
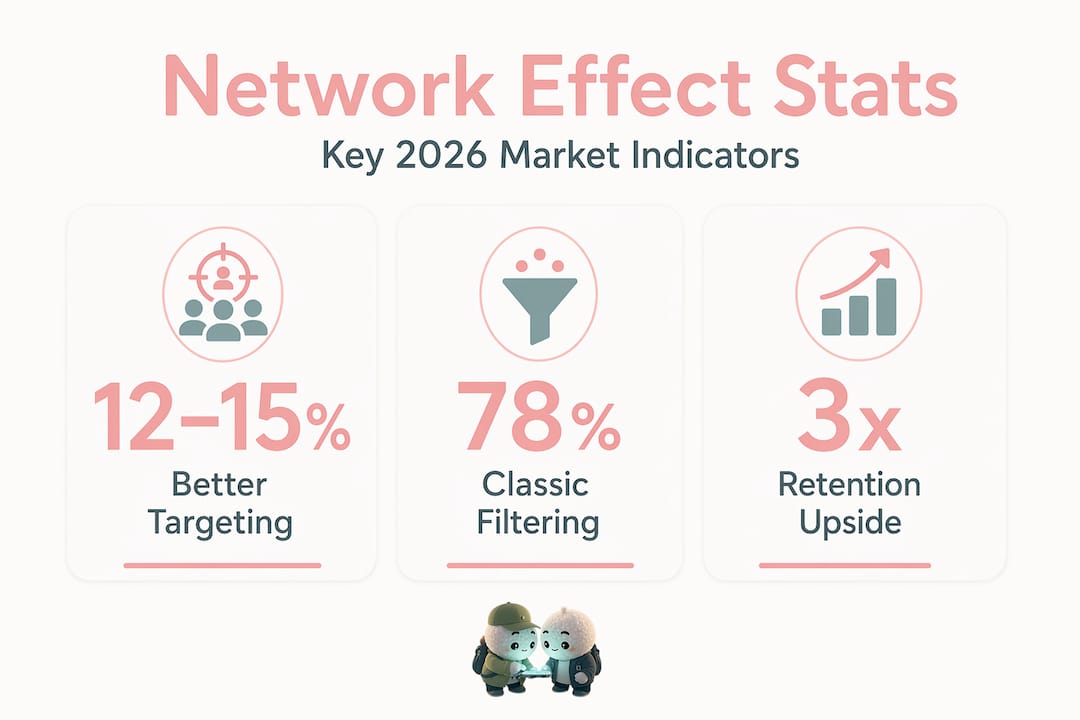
| Standard collaborative filtering | ~78% | Fast, simple, widely used |
| Traditional ML with network features | ~85% | Adds structural context |
| Graph Neural Networks with economic weighting | 94–95% | Captures temporal and relational dynamics |
The practical applications extend well beyond academic research. Marketing precision improves by 12–15% when GNN-derived insights are applied to targeting and personalisation. Cross-selling recommendations become structurally grounded in actual network behaviour rather than superficial product similarity. Centrality scores reveal which product categories sit at the hub of consumer networks, making them disproportionately influential for brand positioning.
For analysts tracking market trends influenced by networks, these metrics offer a fundamentally different view of competitive positioning. A product with high centrality in a consumer network is more defensible than its market share alone would suggest, because disrupting it means disrupting the network connections it anchors.
Pro Tip: When evaluating platform companies, ask for network centrality data alongside engagement metrics. A product that is central to user workflows creates stickiness that retention rates alone will not capture.
Ontherice's AI-driven trend discovery capabilities draw on exactly this kind of signal extraction, identifying which categories and products are gaining network centrality before their momentum becomes visible in revenue figures.
Measuring and building network moats in practice
Knowing that network effects matter is not enough. The competitive advantage comes from measuring them accurately and building them deliberately. Most professionals who work with platform businesses or marketplaces focus on the wrong metrics.
- Prioritise engagement depth over user count: 10,000 disengaged users create weaker network effects than 1,000 engaged, interconnected ones. Track interaction frequency and connection density, not registrations.
- Monitor multi-homing rate closely: if your users are simultaneously active on a competing platform, your network moat is weak. Reducing multi-homing is often more strategically valuable than acquiring new users.
- Measure organic acquisition share: what proportion of new users arrived because existing users brought or recommended them? This is the clearest proxy for whether a genuine self-reinforcing network exists.
- Track network density metrics: cross-side conversion rate (in two-sided markets), connection rate between users, and the ratio of active to dormant accounts all signal the health of network effects rather than just the scale.
- Distinguish virality from defensibility: a campaign can spike user numbers without strengthening the network. If the users acquired through a viral moment do not form connections and interact, they do not contribute to the moat.
For B2B professionals, the most underused lever is designing structural dependencies. When your product sits inside a customer's workflow and connects to their team's data and their partners' integrations, switching cost is no longer about price or features. It is about unpicking a network of connections. That is the durable form of competitive advantage that how network effects shape markets actually describes in practice.
My perspective on where network effects are heading
I have spent considerable time studying how the narrative around network effects has shifted over the past two years, and I think the conventional framing is missing something important.
Most analysts still treat network effects as a binary: either you have them or you do not. What I have observed is that the quality of network interactions matters far more than the count. A platform where users genuinely need each other to accomplish something has categorically stronger effects than one where users simply coexist. The TikTok migration to RedNote looked like proof of network fragility. I read it differently. It was proof that users will tolerate enormous switching friction when they believe the social layer will reconstitute itself on the other side. That tells me network effects are less about the platform and more about the social graph the platform hosts.
The erosion of traditional brand-based effects by AI and media fragmentation is real, but I think it is accelerating a flight to quality rather than a general weakening. Platforms that host high-value, hard-to-replicate interactions are becoming more defensible, while those relying on passive consumption habits are genuinely vulnerable. My advice to analysts and strategists in 2026 is to stop counting users and start mapping interactions. The network that cannot be easily replicated elsewhere is the one worth building.
— Aidil
Discover market signals before the crowd does
Understanding the impact of network effects is only half the equation. Knowing which markets and categories are currently accumulating network momentum is where genuine competitive advantage is built.

Ontherice uses multiple AI engines to scan global data points and extract early signals from noisy market data, identifying which sectors are gaining density and momentum before they reach mainstream awareness. The platform's B2B market signals service is specifically designed for professionals who need to act on network-driven trends before they become consensus. For broader opportunity mapping, AI-identified opportunities surfaces categories where network dynamics are compounding in real time. If you are making strategic decisions about where to compete or invest, these tools translate the theory in this article into live, ranked intelligence you can act on today.
FAQ
What are network effects in simple terms?
A network effect occurs when a product or service becomes more valuable as more people use it. The classic example is a communication platform: its utility grows with every new user who joins.
How do network effects create winner-take-most markets?
Network effects produce compounding value that makes incumbents increasingly difficult to displace. New entrants must solve the cold-start problem while competing against a platform whose existing network already delivers superior utility to users.
Can network effects be broken or reversed?
Yes, though it requires solving the collective action problem. The 2025 TikTok ban showed that government intervention can create a shared migration moment, enabling mass user movement that individual switching incentives alone could not produce.
What metrics best measure network effect strength?
Network density, multi-homing rate, organic acquisition share, and cross-side conversion rate are the most reliable indicators. High organic acquisition and low multi-homing point to a strong, defensible network.
How is AI changing the analysis of network effects in market trends?
Graph Neural Networks can now predict user behaviour with 94–95% accuracy by modelling consumer-product networks with temporal and economic weighting, providing analysts with far more granular insight into network dynamics than traditional engagement metrics allow.