
Leading indicators forecast what is likely to happen; lagging indicators confirm what already did. The practical rule is simple: use leading indicators to guide short-term action and lagging indicators to validate the outcome, and track both side by side rather than picking a favorite.
TL;DR:
- Leading indicators can provide early warnings weeks or months before lagging indicators confirm the outcome, allowing teams to act proactively.
- SaaS teams track weekly leading metrics like trial-to-paid conversions and activation rates, while relying on monthly or quarterly revenue and churn data for final validation.
- Choosing effective indicators requires working backward from your specific success metrics, ensuring the metrics are controllable, measurable, and owned by someone responsible.
- Dashboarding should combine real-time leading indicators with periodic lagging metrics, using multiple signals and validation methods to reduce noise and false positives.
- Overreliance on a single leading indicator and ignoring data revisions or shifts in behavior can lead to incorrect conclusions; combining several signals and regular revalidation are essential.
Table of Contents
- Leading vs lagging indicators: what actually separates them
- Real examples of leading and lagging indicators
- How to choose the right indicators for your goals
- How to measure and dashboard your indicators properly
- Where leading and lagging indicators go wrong
- How Ontherice fits alongside traditional indicators
- Get ahead of the lagging numbers, not just alongside them
- A quick checklist before you trust any indicator
- Sources
Leading vs lagging indicators: what actually separates them
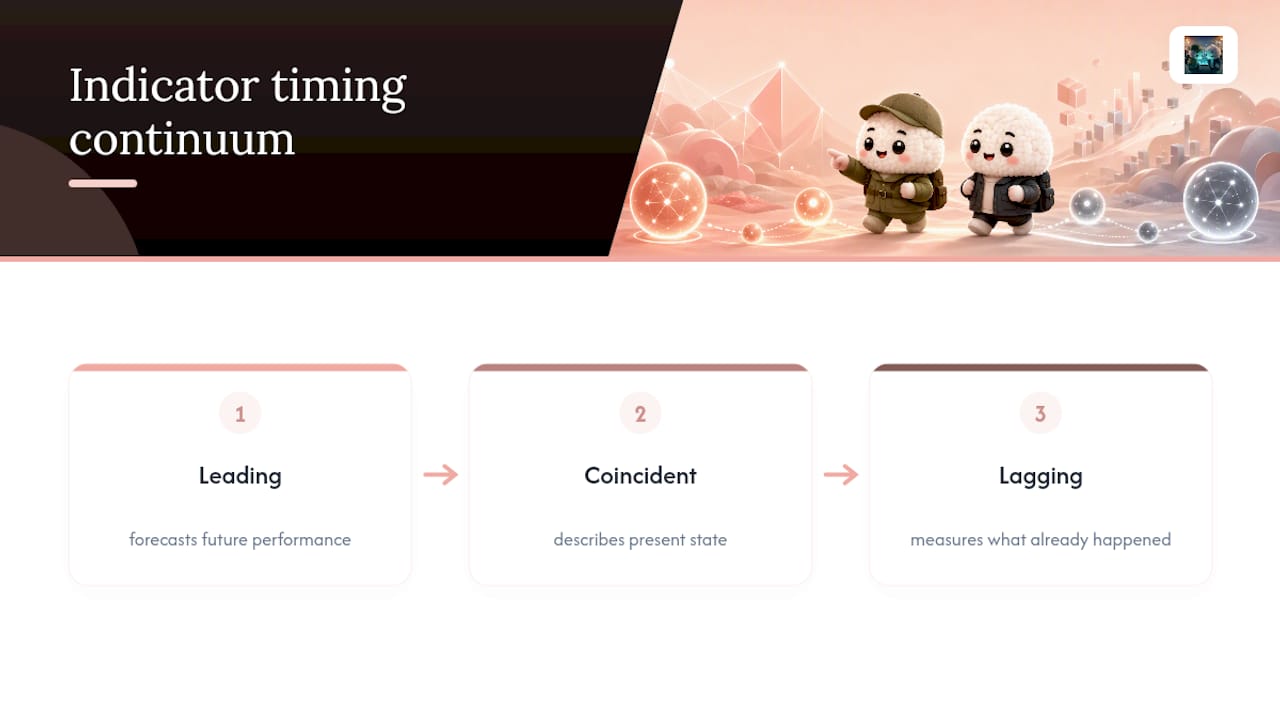
The difference comes down to timing. A leading indicator forecasts future performance before the result exists. A lagging indicator measures what already happened, once the outcome is locked in. Coincident indicators sit between the two, describing the present state of a business or economy as it happens, rather than predicting or confirming it.
That timing gap creates a trade-off analysts run into constantly: precision versus lead time. Lagging measures like revenue or GDP are exact because they're counting something finished. Leading measures like website sessions or a purchasing managers' index (PMI) give you room to act, but that predictive power comes at the cost of certainty. A second trade-off matters just as much: controllability versus reliability. A team can usually influence a leading metric, such as onboarding completion, directly. Nobody can influence GDP directly, which is exactly why it's trusted as a scorecard rather than a lever.
Think of it as a simple taxonomy: leading tells you where things are heading, coincident tells you where things stand right now, and lagging tells you where things ended up. All three feed different decisions, and the strongest measurement systems use all three deliberately rather than defaulting to whichever number is easiest to pull.
Real examples of leading and lagging indicators
In business, especially SaaS, the split is stark. Trial-to-paid conversion rate, activation rate and sessions per user all move before revenue does, and SaaS teams typically monitor these weekly because they're cheap to collect and quick to react to. Monthly recurring revenue (MRR), churn and profit margin sit on the other side. They're accurate precisely because they're final. You can't massage last month's churn number after the fact.
In macroeconomics, the same logic plays out on a bigger stage:
- Consumer confidence index — leading; signals future household spending; tracked monthly.
- PMI (purchasing managers' index) — leading; flags factory-floor momentum before it hits GDP; tracked monthly.
- Yield curve — leading; an inverted curve has preceded most recent recessions; tracked continuously by markets.
- Trial-to-paid conversion rate — leading; predicts near-term revenue growth; tracked weekly.
- Activation rate — leading; predicts retention months out; tracked weekly.
- Unemployment rate — lagging; confirms economic damage after it has occurred; tracked monthly.
- GDP — lagging; the final scorecard on economic output; tracked quarterly.
- Corporate profits — lagging; confirms whether a strategy actually worked; tracked quarterly.
- MRR/ARR and churn — lagging; confirm whether product and sales motions paid off; tracked monthly.
Each pair does a different job. PMI or consumer confidence gives a market strategist weeks of runway before a downturn shows up in GDP. Activation rate gives a product team the same runway before churn shows up in the books. That's the entire value of a leading signal: it buys you time to change course before the lagging number locks the result in.
How to choose the right indicators for your goals
Pick indicators by working backwards from the outcome you actually care about, not by grabbing whatever metric is already on a dashboard. A five-step framework keeps that discipline honest:
- Start with the outcome. Define the lagging KPI that represents success, such as quarterly revenue or renewal rate.
- Test historical correlation. Look at your own data to see which candidate leading metrics moved ahead of that outcome in the past, not just which ones sound plausible.
- Check controllability. Favour indicators your team can actually influence through day-to-day work over ones that only reflect outside forces.
- Confirm measurability. An indicator that's expensive or slow to collect will get abandoned within a quarter, however good the theory behind it.
- Assign cadence and ownership. Decide how often it's reviewed and who is accountable for acting on it.
Worked example: if the outcome is a revenue target, candidate leading KPIs might be trial-to-paid conversion and activation rate, with MRR as the corresponding lagging KPI that confirms whether those leading efforts paid off. Reusing established, well-documented indicators also makes benchmarking against peers far easier than building bespoke ones from scratch.
Pro Tip: Cap yourself at three to five leading indicators per outcome. More than that and nobody on the team can tell you, off the top of their head, which numbers actually matter this week. Revalidate the set every two quarters. Markets shift and so does what predicts what.
How to measure and dashboard your indicators properly
Different indicator types need different data pipelines and different refresh rates. Product usage metrics can update in near real time. Macroeconomic series like PMI or consumer confidence update monthly. GDP updates quarterly and often gets revised afterwards.
Dashboards work best when they track leading indicators continuously and lagging indicators periodically, rather than forcing everything onto one cadence. A few practices separate a dashboard that actually gets used from one that gets ignored after a fortnight:
- Give the dashboard one north-star lagging metric at the top, with leading indicators feeding into it below.
- Mix cadences deliberately: daily or weekly leading signals alongside monthly or quarterly lagging confirmation.
- Assign a named owner to every metric, plus an alert threshold and a defined action for when it's breached.
- Run rolling-window correlation checks and hold out the most recent period as a validation test before trusting an alert.
A useful benchmark for validation design: reserving the latest period as a holdout window before you operationalise any leading-indicator alert catches false positives that a single historical correlation would miss. Skipping that step is how teams end up chasing noise. For teams weighing which platform can actually support that kind of layered tracking, it's worth comparing AI-native versus augmented market insights tooling before committing to one dashboard stack.
Where leading and lagging indicators go wrong
Overreliance on a single leading signal is the most common failure. One metric spiking or dipping rarely means what it looks like it means in isolation.
Short-term leading signals are also naturally noisy, which is exactly why they lead. And economic series get revised well after first release, so an early GDP or employment print should be treated as provisional, not final.
- Combine several leading signals rather than betting on one.
- Revalidate correlations on a fixed schedule, not just when something breaks.
- Pair leading and lagging measures with a coincident indicator to see the current state clearly.
- Treat first-release economic data as provisional until revisions settle.
Indicator behaviour also shifts over time. Unemployment used to be a textbook lagging indicator, yet it became noticeably more responsive after the 2008 to 2012 cycle as labour markets grew more flexible. A framework that worked five years ago can quietly stop working without anyone noticing until the numbers diverge.
How Ontherice fits alongside traditional indicators
Traditional leading indicators like PMI or activation rate are useful precisely because they're well understood, but they're often published on a delay or built from a narrow slice of data. Some platforms scan public data across finance, products, technology and other markets to surface early signals before they reach mainstream visibility, functioning as an additional leading input rather than a replacement for the KPIs you already track.
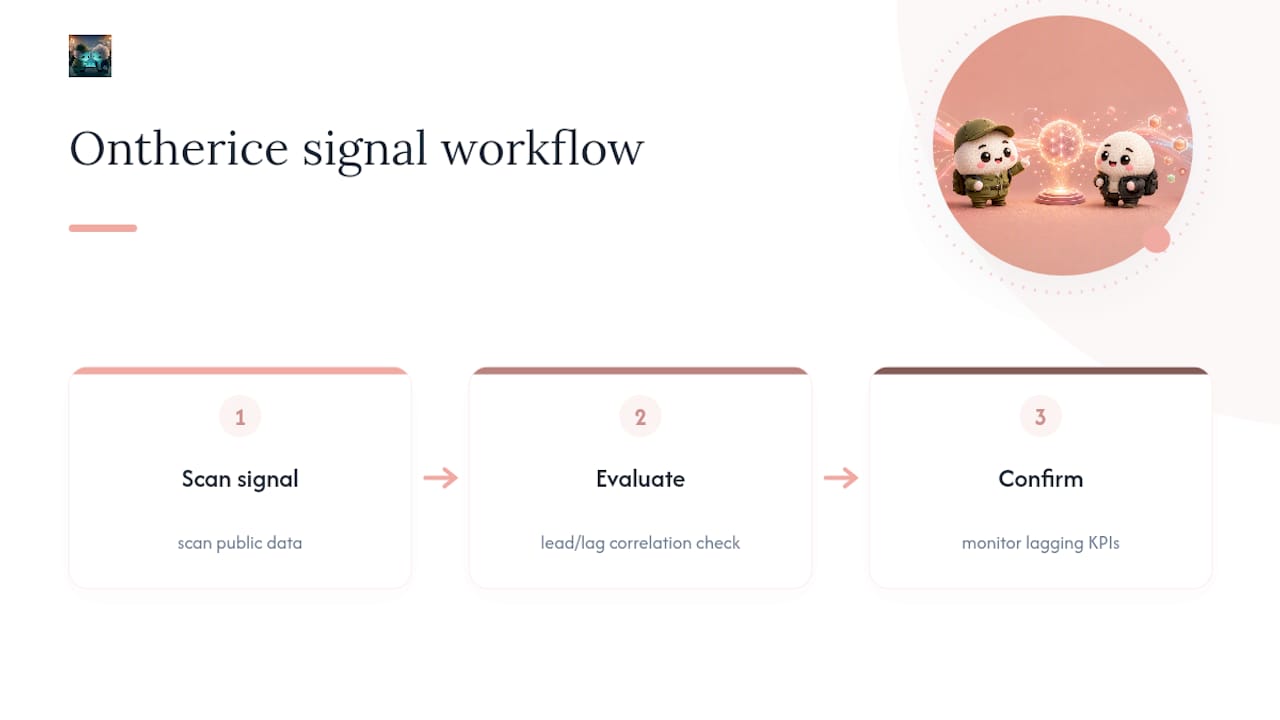
The practical sequence: treat an Ontherice signal as a candidate leading indicator, run it through the same lead/lag correlation check you'd apply to any other metric, then watch your existing lagging KPIs to confirm whether the signal actually held up. For readers building out that muscle, Ontherice's guide on tracking adoption catalysts and its breakdown of key growth signals both walk through the mechanics in more depth.
Get ahead of the lagging numbers, not just alongside them
Most teams are fine at measuring lagging indicators. Far fewer build the discipline to act on leading ones before the outcome is locked in, and that gap is where competitive advantage actually lives. If you want a head start on the signals that eventually turn into headline lagging numbers, Ontherice's SignalsInternational feed tracks early market movement across sectors before it becomes obvious, and the GeneralSignals product works well as a broader monitoring layer if you're not chasing one specific market yet.
A quick checklist before you trust any indicator
Run this before adding a metric to your dashboard: does it correlate with a real outcome you can name, can your team actually influence it, can you measure it cheaply enough to sustain, and does someone own it with a defined response? If you can't answer all four, don't add it yet.
The mistake to watch for is overfitting an indicator to a short run of data. Six good weeks of correlation is a coincidence until proven otherwise; a full cycle of validation is what earns a metric its place on a dashboard. For more on building that validation habit, Ontherice's blog on trend adoption rate is a solid next stop.
— Aidil
Sources
- Leading vs. Lagging Indicators (With Real-World Examples)
- Leading indicator definition and examples
- Leading vs lagging indicators: a guide for your business
- Lagging and leading indicators explained