
Watch five things: the macro trio of Leading Economic Index, PMI, and yield curve; market flows and credit spreads; company-level hiring and capex; demand signals like search and sales inflection; and tech or regulatory catalysts. None of these works alone. The Conference Board's Leading Economic Index typically anticipates turning points by around seven months, but a single reading can mislead if you ignore corroborating data from credit markets or job postings.
Analysts who time industry growth well build a composite picture rather than betting on one number. A falling PMI, a widening credit spread, and a hiring slowdown appearing together tell you far more than any one of them in isolation.
- Macro: LEI, PMI, yield curve slope, unemployment, GDP
- Market: credit spreads, sector equity flows, earnings revisions, capex trends
- Company: hiring breadth, revenue growth, backlog, capex announcements
- Demand: search inflection, sales volumes, site traffic, building permits
- Catalysts: regulation, technology standards, infrastructure roll-out
Pro Tip: Direction and velocity beat absolute levels almost every time. A PMI sliding from 55 to 51 is a warning sign even though it's still above the expansion line.
Key Takeaways
No single indicator reliably times industry growth; the strongest signal comes from corroboration across macro, market, company, and demand data confirmed by breadth and velocity.
| Point | Details |
|---|---|
| Watch direction, not levels | A falling PMI still above 50 can warn of a slowdown before the headline number does. |
| Use the macro triple | Combine LEI, PMI, and yield curve slope to classify the current cycle phase. |
| Prioritise breadth over volume | Track how many distinct firms are hiring or growing, not just one large mover. |
| Corroborate before acting | Require at least two independent signal groups to agree before committing capital. |
| Use Ontherice for ingestion | Ontherice normalises public datasets and tracks accuracy transparently to speed composite scoring. |
Table of Contents
- What counts as an industry showing early growth?
- Which macro indicators actually lead the cycle?
- What do market and credit signals reveal about momentum?
- What company-level signals confirm real expansion?
- How do you spot demand signals before they show up in sales?
- What technology and regulatory catalysts accelerate growth?
- How does competitive structure shape whether signals translate into growth?
- How do you build a composite scoring framework?
- How do you turn a signal into a decision?
- What are the most common signal-reading mistakes?
- What did the signals look like before generative AI took off?
- How do platforms validate signals before publishing them?
- How I actually use these signals week to week
- Where OnTheRice fits into your monitoring workflow
- Frequently asked questions
- Sources
What counts as an industry showing early growth?
An industry is showing early growth when demand and investment rise together, adoption broadens beyond early adopters, and incumbents start reacting rather than ignoring the space. That's a stricter bar than a single good quarter. It means capital is following demand, not just chasing a headline.
Analysts tracking indicators of sector expansion look for three outcomes specifically:
- New category formation, where a product or service creates its own budget line rather than competing for an existing one
- Durable revenue growth across multiple companies, not just one breakout name
- Rising gross margins among early leaders, showing pricing power rather than discounting to win share
Cyclical expansion and structural growth look similar for a quarter or two, but they diverge fast. Cyclical growth fades when the broader economy cools; structural growth keeps compounding because something has permanently changed, whether that's a technology, a regulation, or consumer behaviour.
Which macro indicators actually lead the cycle?
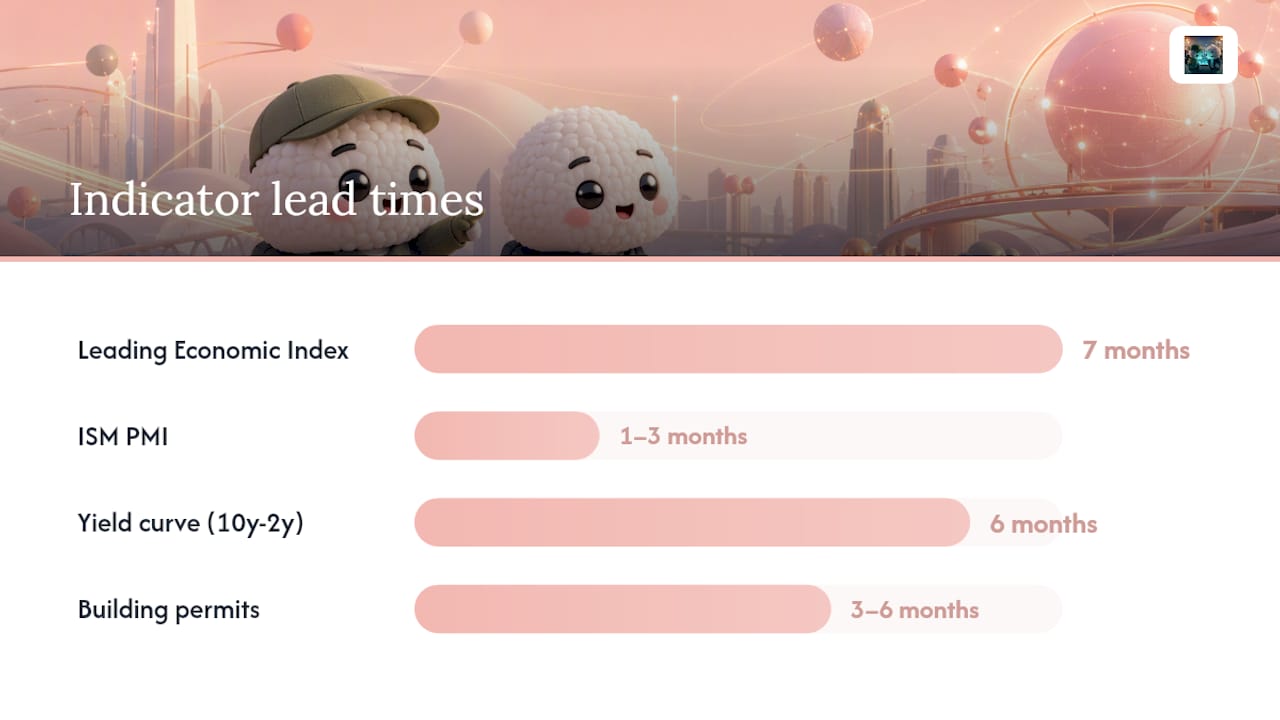
Four official series do most of the heavy lifting, and each has a different lead time worth knowing before you rely on it.
The Leading Economic Index combines ten components, including building permits, manufacturing new orders, and stock prices, into a single composite that has historically led business-cycle turning points by roughly seven months. Its companion, the Coincident Economic Index, tracks current conditions and correlates closely with real GDP, making it a useful check on where the economy actually stands today rather than where it's heading.
ISM's Purchasing Managers' Index matters less for its absolute reading than for its direction. A PMI above 50 signals expansion, but the rate of change often tells you more than the level itself. Yield curve slope, specifically the gap between 10-year and 2-year Treasury yields, has a long history of flagging recessions before they arrive, and sector rotation research treats it as one leg of a three-part macro read alongside PMI and credit spreads.

GDP and unemployment data confirm rather than predict; they arrive too late to time entry but are useful for validating a call you've already made. Building permits matter specifically for construction-heavy industries, since they precede actual construction activity by months.
| Indicator | Typical signal | Lead time |
|---|---|---|
| Leading Economic Index | Composite turning-point warning | 7 months |
| ISM PMI | Direction of manufacturing activity | 1-3 months |
| Yield curve (10y-2y) | Recession risk, sector rotation | 6 months |
| Unemployment/GDP | Confirmation, not prediction | Lagging |
| Building permits | Construction sector demand | 3-6 months |
Composite models built on the macro triple are probabilistic rather than perfect. QuantDecoded's research is explicit that these signals help classify cycle phase, not guarantee an outcome.
What do market and credit signals reveal about momentum?
Credit spreads move before headlines do. When the gap between high-yield and investment-grade bonds widens, lenders are pricing in more risk, often months before that risk shows up in earnings reports. Tightening spreads suggest the opposite: capital is getting cheaper and more available for a sector.
Equity flows tell a faster story. Sector ETF rotations show where institutional money is actually moving in near real time, and tracking allocation shifts across many large funds gives a stronger signal than watching any single fund's moves. Earnings revisions and capex trends round out the picture. When analysts across a sector start raising forward estimates in the same quarter, that's rarely coincidence.
- Credit spreads (HY minus IG): widening signals rising risk perception, often 3-6 months ahead of earnings weakness
- Sector equity flows: timely but noisy; confirm with volume and breadth
- Earnings revisions: upward revisions across multiple firms signal genuine momentum
- VC funding velocity and M&A activity: institutional capital validating a thesis, with staging from seed through Series A and Series B marking increasing maturity
Sector business cycle work shows that different sectors lead or lag at different points in the cycle, which is exactly why rotation strategies treat timing as sector-specific rather than universal.
What company-level signals confirm real expansion?
Hiring velocity matters, but breadth matters more. A single large employer running a hiring spree can distort raw job-posting counts across an entire niche. Tracking the number of distinct companies hiring gives a cleaner read on whether growth is broad-based or concentrated in one outlier.
Revenue growth, backlog, and orders are the hard evidence. Backlog specifically tells you what's already committed, not just what a company hopes to sell. Capex announcements confirm intent: companies don't build factories or sign long leases speculatively.
- Hiring breadth (distinct firms, not raw postings) signals committed, budgeted expansion
- Revenue growth paired with rising backlog confirms demand is real, not promotional
- Capex announcements show multi-year confidence rather than a single strong quarter
- Earnings beats and guidance upgrades from public companies offer short-term confirmation of sector-wide momentum
Pro Tip: Normalise your company KPIs across subsectors before comparing them. Pick 5 to 10 core metrics per sector, since financial KPI research shows high-performing teams track a tight set rather than dozens of loosely related numbers.
How do you spot demand signals before they show up in sales?
Search demand often inflects before purchase behaviour does. The key distinction is educational queries versus commercial ones: someone searching "what is X" is curious, someone searching "buy X near me" or "X pricing" is close to a decision. A rising share of commercial queries within a category is one of the clearer signals of economic progress at the demand level.

Site traffic, conversion rates, and point-of-sale volumes corroborate the search signal once it starts converting. Retail-specific work highlights inventory turns and revenue per square foot as parallel confirmation metrics in physical retail sectors.
| Signal | Market phase indicated |
|---|---|
| Rising commercial query share | Early demand formation |
| Traffic growth with flat conversion | Awareness building, not yet buying |
| Sales volume growth with rising AOV | Confirmed demand, pricing power |
| Inventory turns accelerating | Mature demand, supply catching up |
Always adjust for seasonality before drawing conclusions; a spike in November search volume means something different for retail than for enterprise software.
What technology and regulatory catalysts accelerate growth?
Some growth doesn't come from demand building slowly. It comes from a single event that removes a barrier overnight, new regulation opening a market, a platform change altering distribution economics, or a technology standard reaching critical mass.
You can detect these before they hit headlines by watching legislative calendars, public consultation activity, and vendor SDK adoption rates. A sudden jump in developer tooling adoption around a new API often precedes commercial adoption by a year or more.
- New or changed regulation that removes a compliance barrier
- Platform or protocol shifts that change unit economics for an entire category
- Infrastructure roll-out (broadband, charging networks, payment rails) that enables previously unviable business models
- Standards adoption reaching a critical mass among vendors
Pro Tip: Watch for the 20 to 30 percent technology penetration threshold. Foundational technologies tend to trigger network effects once adoption crosses that band, after which growth often accelerates rather than continuing linearly.
How does competitive structure shape whether signals translate into growth?
Positive signals mean different things depending on market structure. A fragmented market with low concentration turns early signals into real opportunity for new entrants. A concentrated market dominated by two or three incumbents can absorb the same signals without creating room for anyone else.
Watch how incumbents respond. Aggressive pricing cuts, a wave of acquisitions, or unusual executive churn can mean incumbents feel threatened, which is itself a signal, but it can also mean they're locking the door before challengers get through it. Supply and distribution constraints controlled by a handful of players raise entry risk regardless of how strong the demand signals look.
- High concentration plus aggressive incumbent pricing usually raises entry risk
- Rapid incumbent acquisitions can signal both a real threat and a validated opportunity for adjacent entrants
- Fragmented markets with weak distribution barriers convert demand signals into scalable opportunity more reliably
How do you build a composite scoring framework?
Group your signals into five buckets: macro, market, company, demand, and catalyst. Weight macro and market signals lower for early-stage sectors, since they move slowly and reflect the broader economy more than any single industry. Weight company and demand signals higher when you're trying to catch something early, since they respond faster to what's actually happening.
Score each signal on three dimensions: directionality (is it improving or worsening), velocity (how fast is it changing), and breadth (how many independent sources agree). When signals conflict, don't average them away. Investigate why they disagree first; the disagreement itself is often informative.
| Signal group | Example weight | What it captures |
|---|---|---|
| Macro | 20 to 30 percent | Broad economic backdrop |
| Market/financial | 20% | Capital allocation and pricing |
| Company | 30% | Committed investment and scaling |
| Demand | 20 to 30 percent | Customer pull and purchase intent |
| Catalyst | 10% | Structural or regulatory step changes |
Pro Tip: Back-test any threshold you set against at least two previous cycles before trusting it live. A weighting scheme that worked in one expansion can fail badly in another if it wasn't stress-tested first.
How do you turn a signal into a decision?
Different signals need different monitoring cadences. Real-time dashboards suit flows and search data, which change daily. Weekly checks work for job postings and company announcements. Monthly reviews suit LEI and PMI releases, which simply don't update fast enough to justify daily attention.
Before acting, validate. Check that a move survives seasonal adjustment, confirm it appears across multiple independent sources, and test breadth, meaning it's not just one company or one region driving the whole reading.
A simple decision flow works well in practice:
- Signal detected and flagged by your monitoring dashboard
- Quick validation against seasonality and at least one corroborating source
- Small pilot or test-market commitment if validation holds
- Scale the commitment or shelve it based on pilot results
Pro Tip: Set guardrail metrics before you commit capital, not after. Decide in advance what would make you reverse a pilot, so a bad signal doesn't get rationalised after the money is already spent.
Consistent tracking of industry momentum across these cadences turns a one-off insight into a repeatable process your whole team can trust.
What are the most common signal-reading mistakes?
Relying on a single indicator is the most common error, closely followed by misreading late-cycle signals as fresh expansion when they're actually a final surge before a slowdown. Short-term noise gets overfitted into false patterns more often than analysts admit.
- Require corroboration across at least two independent signal groups before acting
- Use z-scores and seasonally adjusted series rather than raw numbers
- Track breadth across firms, not just headline totals from one or two large players
Pro Tip: Stress-test your thresholds against a past idiosyncratic shock, not just a normal cycle. A model tuned only on smooth expansions tends to break the first time something genuinely unusual happens.
What did the signals look like before generative AI took off?
Search interest and developer hiring for machine learning roles began climbing well before mainstream coverage. Series A funding for applied AI start-ups accelerated sharply once foundational model access broadened, and incumbents responded with rapid capex increases on compute infrastructure within a year.
Hiring and search data gave early warning; the funding acceleration and incumbent capex response confirmed the trend was structural rather than a passing spike. An analyst following the composite framework would have flagged the sector for a pilot allocation once hiring breadth and funding velocity corroborated each other, well before mainstream demand caught up.
How do platforms validate signals before publishing them?
Reliable signal detection depends on where the data comes from and how it's cleaned before anyone sees it. Official series like LEI, PMI, and BLS payroll data anchor the macro layer. Job posting feeds, search indices, and funding databases fill in the company and demand layers, and AI platforms that scan global data are increasingly used to catch subtle shifts in these areas before they're widely reported.
Validation matters as much as collection. Outlier filtering removes noise from a single volatile data point, seasonal adjustment strips out predictable annual patterns, and cross-source corroboration checks that a signal isn't an artefact of one dataset's quirks. Back-testing against prior cycles is the final check before a signal gets trusted.
- Official macro series for the slow-moving backdrop
- Job posting and hiring data for company-level committed investment
- Search and funding databases for demand and capital validation
- Outlier filtering, seasonal adjustment, and cross-source checks before publication
Transparent accuracy tracking, which shows how often past signals actually preceded real growth, is what separates a credible signal platform from a black box. OnTheRice publishes this kind of tracking alongside its ranked sector cards specifically so users can judge signal reliability for themselves rather than taking it on faith.
How I actually use these signals week to week
My working rhythm is simple: alert thresholds catch the loud moves, a weekly signal review catches the quiet ones, and a monthly meeting forces a decision rather than endless watching. Most false starts I've seen come from analysts reacting to a single strong data point instead of waiting for corroboration.
The one habit that's saved me more than any framework: tracking hiring breadth across fifty or more firms in a niche before believing a growth story. One company's hiring spree tells you nothing about a sector. Fifty companies quietly hiring in the same direction tells you almost everything.
Where OnTheRice fits into your monitoring workflow
Building this composite framework by hand means pulling data from a dozen sources, cleaning it, and re-running the maths every week. Ontherice does that ingestion and normalisation continuously, pulling from public datasets across finance, hiring, search, and funding, then scoring sectors with the same directionality-velocity-breadth logic covered above.

The platform's accuracy tracking is public, so you can see how past rankings performed rather than trusting a black-box score. For readers who want a working example of ranked signal cards, the AI opportunity feeds show live sector rankings, while the signals introduction page explains the freemium model, core tools are free, deeper insight cards and premium feeds unlock through Access Points. If you're tracking an emerging category right now, start there and see how your own composite view compares.
Frequently asked questions
What are the most reliable key signals for industry growth?
The most reliable approach combines macro indicators (LEI, PMI, yield curve), market signals (credit spreads, equity flows), company data (hiring breadth, capex), and demand signals (search inflection, sales volumes). No single one is reliable alone.
How far in advance do leading indicators predict industry growth?
The Conference Board's LEI has historically led business-cycle turning points by around seven months, though individual sector timing varies and should be corroborated with company and demand-level data.
What's the difference between a leading and a coincident indicator?
A leading indicator, like PMI or building permits, tends to move before the broader economy shifts. A coincident indicator, like GDP or unemployment, reflects conditions as they currently stand and confirms rather than predicts.
How do I avoid false positives when reading growth signals?
Require corroboration across at least two signal groups, use seasonally adjusted and z-scored data rather than raw figures, and check breadth across multiple firms rather than trusting one strong data point.
Can AI platforms like Ontherice replace manual signal analysis?
Ontherice speeds up data ingestion, normalisation, and scoring across many public sources, but the composite framework still benefits from an analyst's judgement on weighting and interpreting conflicting signals.
Sources
For macro data, follow the Conference Board's LEI, ISM's PMI releases, BLS payroll and unemployment reports, and Federal Reserve yield data. For company and market metrics, FactSet's industry datasets offer cross-sector benchmarking, while S&P 500 sector performance tracks broad flow. VC funding databases, job posting APIs, and search indices round out the demand layer, official series update monthly, proprietary feeds often update daily or weekly.
- The Conference Board — Leading and coincident economic indicators (US)
- Sector rotation strategies: timing the business cycle