
Explainable forecasting means building or explaining prediction models so a human can see which inputs drove a specific forecast and trust the result enough to act on it. The recommended route is to reach for an inherently interpretable model first, such as a Temporal Fusion Transformer with variable selection or IB-Forecast, and only fall back to a post-hoc explainer like sampling-free SHAPformer when the underlying model can't be redesigned. Get this right and you gain faster debugging, cleaner audits, and stakeholders who actually believe the number.
TL;DR:
- Inherently interpretable models like TFT and IB-Forecast provide continuous explanations at minimal cost, making them ideal for high-stakes environments.
- Sampling-free SHAPtransformers offer explanation speeds 50 to 1,000 times faster than traditional methods, enabling real-time interpretability at scale.
- Faithfulness metrics and auxiliary data are essential to ensure explanations accurately reflect the model’s decision process; missing inputs can lead to noisy attributions.
- Post-hoc explainers require additional computational overhead and should be used when interpretability is less critical or model redesign isn't feasible.
- Building explainability into the forecasting pipeline involves augmenting data, prototyping interpretable models, and caching explanations for efficiency.
Table of Contents
- What is explainable forecasting and why does it matter?
- What are the main explainability methods for forecasting?
- How do you weigh faithfulness, runtime and data needs?
- When should you choose inherent interpretability over post-hoc explanation?
- How do you add explainability to a forecasting pipeline?
- What are the limitations and failure modes to watch for?
- Ontherice's take on explainable forecasting
- Sources
What is explainable forecasting and why does it matter?
A forecast tells you what will probably happen. An explanation tells you why the model thinks so, which inputs mattered, and how confident that reasoning should be. These are different outputs, and conflating them is where most forecasting projects lose credibility with the people who have to act on the numbers.
The business case is straightforward. Finance teams won't sign off on a revenue forecast they can't defend to auditors. Operations managers won't reroute inventory on a demand spike unless they can see what triggered it. Energy grid operators need to know whether a load forecast is being driven by weather, a public holiday, or a genuine shift in consumption, because each implies a different response.
A few concrete decision points show why this matters:
- Demand planning: a retailer needs to know if a forecast spike comes from a promotion, a competitor stockout, or noise, before committing warehouse capacity.
- Energy load forecasting: grid operators must distinguish a temperature-driven surge from a structural demand shift before dispatching reserve generation.
- Financial forecasting: analysts need attribution to specific macro drivers, not just a number, before presenting to a board or regulator.
Explainable AI transforms how managers act on forecasts, largely because adoption stalls when a model is accurate but opaque. Accuracy alone rarely earns trust; the reasoning behind a number does.
What are the main explainability methods for forecasting?
Explainability approaches split into two families: ante-hoc models that are interpretable by design, and post-hoc explainers bolted onto a black box after the fact. Both have a growing cast of named techniques worth knowing.
Ante-hoc, inherently interpretable models build transparency into the architecture itself:
- Linear and generalised additive models (GAMs) remain the simplest route: every coefficient is a direct, auditable explanation.
- The Temporal Fusion Transformer (TFT) uses variable selection networks and attention layers that expose which time steps and features drove a prediction, without a separate explainer step.
- IB-Forecast, described in a recent arXiv paper, is an interpretable multivariate framework that emits its own explanation during the forward pass, matching black-box accuracy while selecting only a small, budgeted fraction of the input history to justify each prediction.
Post-hoc explainers work on any trained model, interpretable or not:
- SHAP and LIME remain the baseline tools, assigning credit to input features by approximating the model locally.
- TimeSHAP and WindowSHAP adapt Shapley values to sequences, attributing importance across specific time windows rather than treating a series as one flat feature vector.
- SHAPformer is the sampling-free breakthrough for Transformer forecasters: it computes exact SHAP values without the expensive sampling loop, reporting speedups of 50 to 1,000 times over PermutationSHAP with inference under one second per explanation.
- PAX-TS and NVExplain represent the newer perturbation and latent-trajectory camp. PAX-TS produces horizon-resolved explanations with built-in faithfulness diagnostics, while NVExplain attributes forecast horizons back to historical lags at lower computational cost, with stability checks that flag when an explanation shouldn't be trusted.
Runtime gap: standard sampling-based SHAP can take seconds to minutes per forecast on large models. SHAPformer's sampling-free design cuts that to under one second, a difference that decides whether explainability is viable at production scale or confined to weekly audit reports.
The practical distinction that matters most: ante-hoc methods give you a model that explains itself continuously at near-zero marginal cost, while post-hoc methods let you keep an existing black box but add a computational and engineering overhead every time you want a reason.
How do you weigh faithfulness, runtime and data needs?
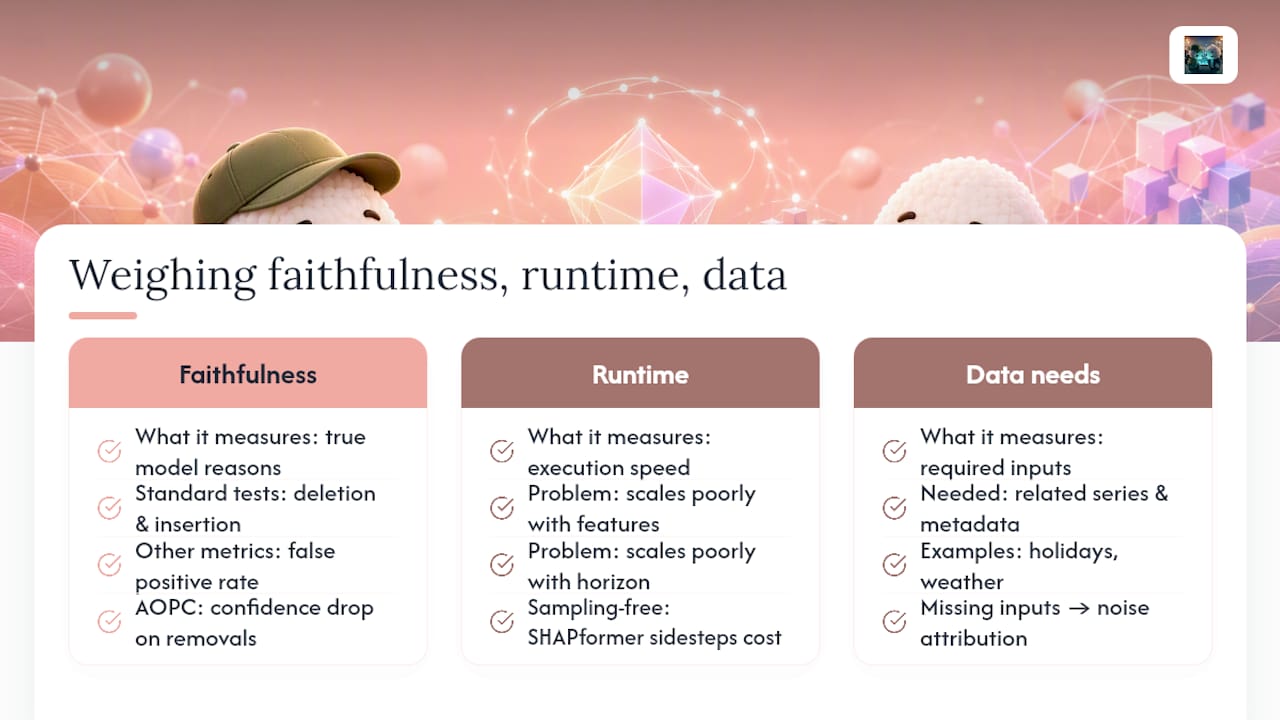
Faithfulness measures whether an explanation actually reflects what the model is doing, not just what looks plausible. The standard tests are deletion and insertion metrics (does remove the flagged inputs actually change the prediction the way the explanation implies?), false positive rate on irrelevant features, and AOPC (area over the perturbation curve), which scores how prediction confidence degrades as important features are progressively removed. Independent evaluations show SHAP-style methods score well on faithfulness across many time-series tasks, but standard sampling-based implementations are often too slow for anything beyond batch analysis.
Runtime is where the real trade-off bites. Sampling-based SHAP scales poorly with feature count and forecast horizon. Sampling-free approaches like SHAPformer sidestep that entirely, and perturbation-driven dynamic window frameworks report substantial runtime reductions versus SHAP baselines while preserving the dominant temporal importance patterns, even if exact speedup factors vary by dataset.
Data needs are the quiet constraint everyone forgets. Amazon Forecast's explainability feature requires related time series or metadata, such as holidays or weather, to compute meaningful impact scores. Skip that input layer and your explanation defaults to noise attribution, not insight.
When should you choose inherent interpretability over post-hoc explanation?
Choose inherent interpretability when stakes are high, regulators are watching, or someone will have to defend a decision months later. Google Research argues that building interpretability into the architecture, through variable selection networks or explicit seasonal decomposition, beats retrofitting a black box, because post-hoc methods can struggle to isolate genuine time-step importance from correlated noise.
Favour efficient post-hoc methods when you're running thousands of series at low latency and redesigning every model isn't realistic. Sampling-free SHAPformer or horizon-aware frameworks like PAX-TS fit that scale better than sampling SHAP ever will.
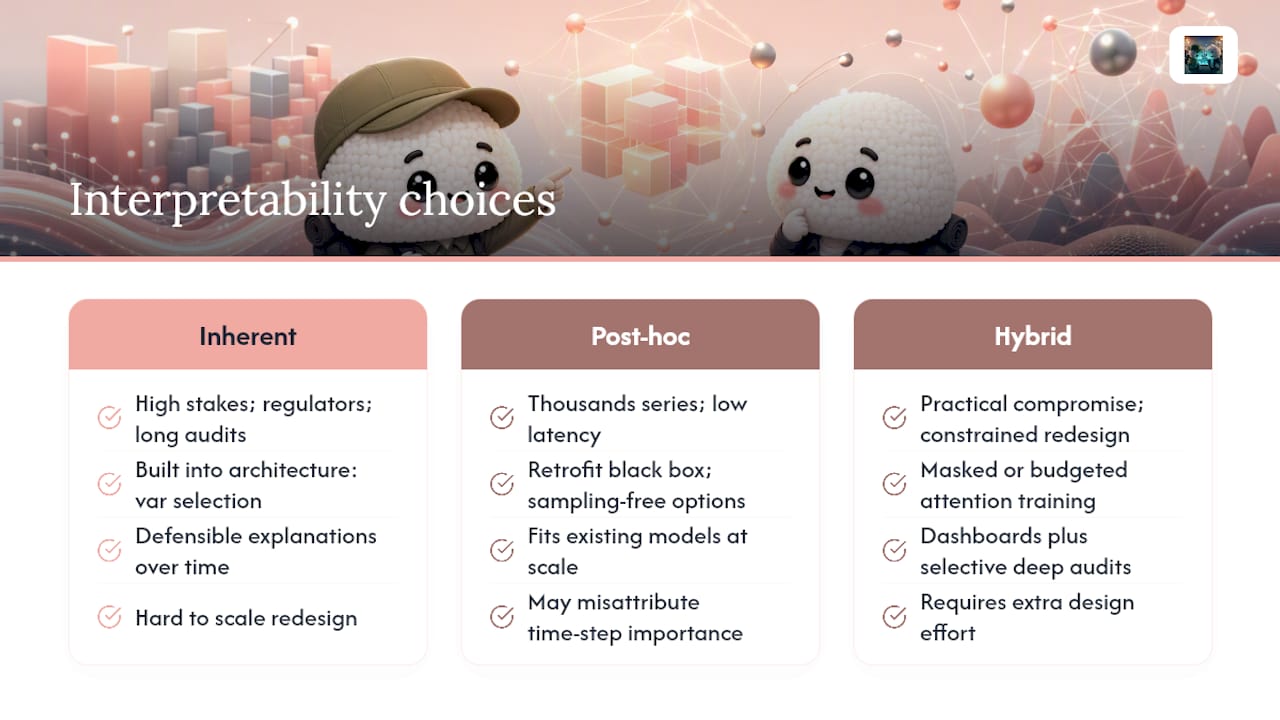
Hybrid strategies split the difference: train with masked or budgeted attention so the model learns to be explainable, then generate lightweight surrogate reports for dashboards and full explanations only for periodic audits.
How do you add explainability to a forecasting pipeline?
- Prepare and augment your data. Assemble related time series, holiday calendars, weather, and other metadata, then sanity-check for gaps, since missing auxiliary inputs quietly degrade explanation quality even when forecast accuracy holds up.
- Prototype an interpretable baseline. Try a GAM, a linear model, or a TFT with variable selection first, and measure the accuracy cost against a black-box alternative before ruling interpretability out.
- If you need post-hoc, pick an efficient method. Compute both local (single-forecast) and global (dataset-wide) explanations, then run deletion/insertion and stability tests before trusting the output.
- Operationalise it. Cache explanations for high-cardinality series, monitor for explanation drift as the underlying data shifts, and set governance rules for who can override a model based on its stated reasoning.
Pro Tip: Precompute and cache explanations for your highest-traffic series overnight, then reserve live, on-demand explanation calls for genuinely new or anomalous forecasts. This alone can be the difference between an explainability layer that ships and one that dies in a latency review.
What are the limitations and failure modes to watch for?
Perturbation-based explainers can generate off-manifold inputs, feeding the model combinations of values it never saw in training, which produces confident-looking but meaningless attributions. Correlated features compound the problem: SHAP-style methods can split credit unpredictably between two variables that move together, making the explanation technically correct but practically misleading.
Never treat an attribution as causal. A feature scoring high in an explanation shows correlation with the model's output, not proof that changing it in the real world would change the outcome.
Show stakeholders stability diagnostics, confidence bands, and the provenance of any auxiliary data (where the weather or holiday feed came from) before anyone acts on a single-point explanation.
Ontherice's take on explainable forecasting
Ontherice builds its ranking and signal engine on the same principle this guide argues for: a forecast without a visible reason behind it isn't worth acting on. The platform's rankings engine is designed around transparent scoring rather than a black-box number, and its live AI query tools let you interrogate a signal the way you'd interrogate a SHAP value, asking what's actually driving it before you move on it. For a hands-on look at applying trend signals to real decisions, the guide on how AI predicts trends is a useful next stop.
— Aidil
Sources
- Explainable time-series forecasting with sampling-free SHAP for Transformers (Nature Communications)
- Efficient XAI in multivariate time series: Perturbation‑based dynamic windows with concept and global explanations
- Interpretable deep learning for time series forecasting (Google Research blog)
- IB‑Forecast: an interpretable multivariate forecasting framework (arXiv)