
TL;DR:
- Behavioral signals in market analysis include consumer complaints, social media sentiment, and job posting velocity, which reveal market sentiment before price movements occur. Combining multiple independent signals, such as divergence and silence indicators, helps analysts identify market turns more reliably and gain a competitive edge. Many professionals underuse these signals by relying on lagging data or single indicators, missing early opportunities.
Behavioural signals in market analysis are measurable actions and psychological indicators that reveal underlying market sentiment before price movements confirm them. Unlike traditional financial metrics, these signals draw from consumer complaints, social media sentiment, job posting velocity, and volatility measures to expose what crowds are actually doing rather than what they say. Higher consumer complaint volumes correlate strongly with short-term stock price declines, giving analysts an early read on reputational and financial risk. The standard industry term for this discipline is behavioural finance, and its application to real-time market data has become one of the most consequential shifts in professional market intelligence over the past decade.

What are the primary types of behavioural signals in market analysis?
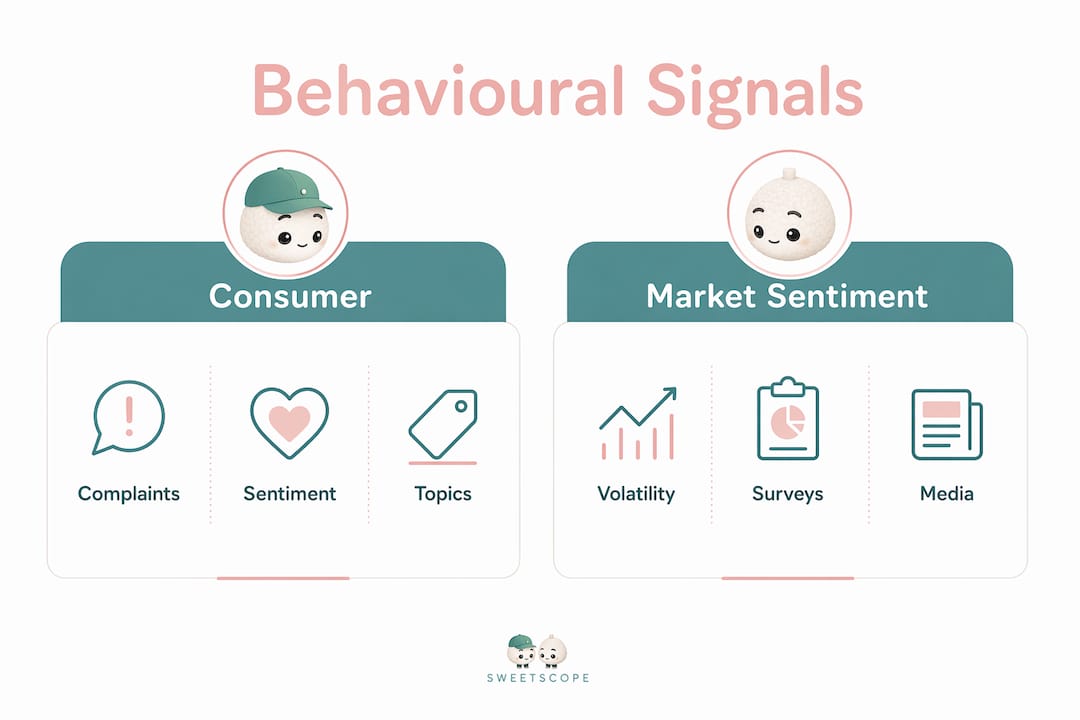
Behavioural signals fall into five distinct categories, each capturing a different dimension of market psychology.
Consumer behaviour signals are the most direct. They include complaint volumes, sentiment polarity, and topic concentration extracted through natural language processing (NLP). When complaint clusters around a specific product or service grow rapidly, they signal deteriorating brand health before earnings reports reflect it. This is not a soft indicator. Consumer complaints linked to stock declines represent a quantifiable, repeatable pattern across sectors.
Social media sentiment divergence is a subtler but equally powerful signal. A large language model trained on nearly 10,000 labelled samples and applied to 80 million social media posts found that sentiment divergence suppresses informed trading by raising transaction costs and reducing the camouflage that sophisticated traders rely on. That finding reframes social sentiment from a simple mood gauge into a structural market force.
Real-time business signals include job posting velocity and search demand inflection. These are forward-looking by nature. When a category shows search demand growing above 30% quarterly and job postings rising more than 20% month over month for three consecutive months, the data indicates genuine market readiness rather than speculative noise.
Volatility-based signals measure the gap between implied and realised volatility. A low gap between implied and realised volatility signals a diminished risk premium cushion for option sellers, demanding tighter risk management. This is a regime signal, not a directional one.
Mass psychology indicators include AAII sentiment surveys, put/call ratios, and mainstream media coverage patterns. These indicators provide early warnings about crowd behaviour stages and market extremes, particularly when they reach readings that historically precede reversals.
Pro Tip: Never treat any single category as sufficient. The highest-confidence signals occur when consumer sentiment, volatility data, and business activity metrics all point in the same direction simultaneously.
How do behavioural signals influence market trend analysis and decision-making?
Behavioural signals outperform lagging fundamental data precisely because they capture intent and emotion before those forces appear in earnings or price charts. Quarterly reports describe what happened. Behavioural data describes what is happening now and what crowds are about to do next.
The most reliable signal in this framework is divergence. Sentiment almost always follows price, so the moment it stops doing so, something structurally significant is occurring. Bullish sentiment diverging from price lows, or bearish sentiment diverging from price highs, acts as an early-warning signal for market turns. Analysts who wait for price confirmation alone will always be late.
Integrating behavioural signals into decision-making follows a clear sequence:
- Identify the regime. Classify the current market phase using price structure and institutional positioning before applying any sentiment overlay. Continuous regime classification produces more nuanced decisions than binary buy or sell signals.
- Map sentiment against price. Plot sentiment readings against price action over a rolling window. Divergences lasting more than five trading sessions carry the most predictive weight.
- Confirm with business activity data. Job posting velocity and search demand growth validate whether the sentiment shift reflects genuine economic activity or purely speculative repositioning.
- Assess volatility context. Check whether implied and realised volatility are converging or diverging. Convergence signals a market environment that demands caution rather than trend-following.
- Apply mass psychology filters. Use AAII surveys and put/call ratios to assess crowd positioning extremes before committing to a directional view.
"Mass psychology signals such as the transition from panic to boredom provide more reliable bottom-finding cues than price alone, because the crowd loses interest before it loses fear."
This insight reframes how analysts should interpret silence in the market. When discussion about a falling asset stops entirely, that absence of noise is itself a signal. It is often more reliable than active negative chatter as an indicator of a genuine bottom.
What methods and tools help analysts evaluate and quantify behavioural signals?
The methodology for evaluating behavioural signals has matured considerably. NLP and sentiment analysis now process millions of data points from consumer complaints and social media in near real time. The shift from rule-based sentiment scoring to large language model approaches has improved accuracy substantially, particularly for nuanced or ironic language that older systems misclassified.
Combining multiple independent signals is the single most important methodological discipline. Market analysts require three or more independent signals to reduce false positives in timing decisions. Social sentiment, fund flows, and job posting velocity together constitute the highest-weight confluence combination in professional practice.
The table below compares the primary evaluation methods by data source, output type, and primary use case.
| Method | Data source | Output | Primary use |
|---|---|---|---|
| NLP sentiment analysis | Consumer complaints, social media | Polarity score, topic clusters | Reputational risk, early trend detection |
| LLM-based divergence modelling | Social media posts at scale | Sentiment divergence index | Informed trading suppression analysis |
| Job posting velocity tracking | Job boards, HR platforms | Month-over-month growth rate | Market entry timing, sector readiness |
| Search demand inflection analysis | Search engine trend data | Quarterly growth percentage | Demand confirmation, category momentum |
| Volatility spread monitoring | Options markets | Implied vs realised gap | Risk regime classification |
A market timing dashboard standardises these inputs using colour-coded growth-rate thresholds. Standardised growth thresholds such as 30% quarterly search growth and 20% month-over-month job posting velocity give analysts consistent criteria rather than subjective judgements. Real-time proxies always take precedence over lagging official data in these frameworks.
Pro Tip: Build your dashboard around real-time proxies first. Official economic data arrives weeks after the behavioural signal has already moved the market.
For analysts seeking early insight sources that go beyond conventional data feeds, integrating multiple signal types into a single ranked view is the most practical starting point.
What are common challenges when interpreting behavioural signals?
Behavioural signals are powerful, but they carry structural limitations that analysts must account for before acting on them.
- Retail-dominated markets distort signal reliability. Sentiment divergence is strongest in markets with short-selling constraints, such as China and comparable emerging markets. In these environments, informed traders cannot easily offset crowd behaviour, so price efficiency suffers and signals become noisier.
- Disclosure speed affects signal quality. The faster and more fairly information is disclosed across market participants, the more reliable sentiment-based signals become. Uneven disclosure creates asymmetric signal environments where the same indicator carries different weight depending on market structure.
- Single-indicator reliance produces false positives. A spike in negative social sentiment without corresponding job market deterioration or volatility expansion is frequently a temporary emotional reaction rather than a structural shift.
- Absence of market makers alters patterns. In thinly traded markets without active market makers, behavioural signals can amplify rather than predict price moves, creating feedback loops that mislead analysts using frameworks built for liquid markets.
- Emotional contagion compounds interpretation errors. Crowd psychology dynamics mean that fear and euphoria spread faster than information. Analysts who fail to distinguish between genuine sentiment shifts and contagion-driven noise will systematically misread signal strength.
Understanding emergent market behaviour patterns helps analysts separate genuine structural signals from crowd-driven noise, particularly during periods of high volatility.
How can analysts apply behavioural signals for competitive advantage?
Translating behavioural signals into competitive advantage requires discipline and a structured application framework. The goal is not to react to every signal but to act decisively when multiple signals converge.
- Time market entries using momentum data. Job posting velocity above 20% month over month for three consecutive months, combined with search demand growth above 30% quarterly, identifies sectors approaching inflection. Enter before mainstream capital arrives.
- Identify market bottoms through silence signals. The most reliable bottom indicator is not panic but the complete cessation of discussion about a falling asset. Experts prioritise this "silence signal" above active negative chatter because it marks the point where the crowd has fully disengaged.
- Classify the volatility regime before positioning. When the 20-day realised volatility on the S&P 500 doubled from under 9 to approximately 18 within a single month in 2026, that shift demanded a fundamental change in risk posture. Trend-following strategies become dangerous in high-volatility regimes.
- Monitor institutional activity alongside sentiment. Insider buying combined with positive sentiment divergence from price lows creates a high-conviction signal. Either alone is insufficient. Together, they indicate that informed participants are acting against the crowd's pessimism.
- Integrate behavioural signals with traditional analytics. Behavioural data does not replace fundamental analysis. It provides timing precision that fundamentals cannot. The strongest decisions combine both.
Pro Tip: Track trend velocity metrics alongside sentiment data. Velocity tells you how fast a signal is accelerating, which determines whether you have days or weeks to act.
Regulatory and infrastructure catalysts also create non-optional behavioural shifts. Regulatory catalysts force market adoption, generating timing signals that are unusually reliable because participation is compelled rather than voluntary.
Key takeaways
Behavioural signals deliver their highest value when analysts combine sentiment divergence, volatility regime data, and real-time business activity metrics into a single, disciplined decision framework.
| Point | Details |
|---|---|
| Divergence is the core signal | When sentiment stops following price, a market turn is likely approaching. |
| Confluence reduces false positives | Require three or more independent signals before acting on any timing decision. |
| Silence signals market bottoms | Complete absence of discussion about a falling asset is more reliable than active panic. |
| Volatility regime determines strategy | Implied and realised volatility convergence demands caution, not trend-following. |
| Real-time proxies beat lagging data | Job posting velocity and search demand inflection arrive weeks before official economic data. |
Why I think most analysts still underuse behavioural signals
When I started working with market data, behavioural signals were treated as supplementary colour at best. Fundamental analysts viewed sentiment data with open scepticism, and volatility signals were the exclusive territory of options desks. That separation has cost a great many professionals dearly.
The most common mistake I see now is treating behavioural signals as confirmation tools rather than leading indicators. Analysts wait for price to validate the signal, which defeats the entire purpose. The signal's value lies precisely in its early arrival. By the time price confirms, the opportunity has already been partially priced in.
The second mistake is ignoring the silence signal. Analysts are trained to look for activity, for volume spikes, for sentiment extremes. The absence of those things feels like nothing worth measuring. In practice, the moment a falling asset stops generating discussion is often the most important moment in its entire cycle.
AI-driven analysis is changing this. Platforms that process millions of data points in real time and surface ranked signals are giving analysts access to behavioural intelligence that previously required entire research teams. The analysts who will lead in the next decade are those who combine that computational power with the qualitative discipline to know which signals to trust and when to act. Neither alone is sufficient.
— Aidil
How Ontherice supports behavioural signal analysis
Ontherice applies multiple AI engines to scan global data points and surface ranked signals across sectors, giving market analysts a structured view of what is gaining momentum before it reaches mainstream awareness.

The platform's AI-driven opportunities tool identifies emerging behavioural signals across asset classes and sectors, presenting them through a transparent ranking system that analysts can interrogate in real time. For professionals who want to go deeper, Ontherice publishes detailed market intelligence whitepapers covering the methodologies behind its signal detection and scoring. The platform is built for analysts who need early, evidence-based intelligence rather than lagging consensus views.
FAQ
What are behavioural signals in market analysis?
Behavioural signals are measurable actions and psychological indicators, such as consumer complaints, social media sentiment, and job posting velocity, that reveal market sentiment and likely price movements before they appear in traditional financial data.
How does sentiment divergence work as a market signal?
Sentiment divergence occurs when crowd sentiment stops following price direction. Bullish sentiment at price lows and bearish sentiment at price highs both indicate that a market turn is approaching, making divergence one of the most reliable early-warning indicators available.
Why do analysts need multiple signals rather than one?
Professional practice requires three or more independent signals to reduce false positives in timing decisions. A single signal, such as a spike in negative social sentiment, frequently reflects a temporary emotional reaction rather than a genuine structural market shift.
What is the silence signal and why does it matter?
The silence signal occurs when discussion about a falling asset stops entirely. Experts treat this as a more reliable market bottom indicator than active panic, because crowds lose interest before they fully lose fear.
How does volatility data function as a behavioural signal?
When implied and realised volatility converge, the risk premium cushion for option sellers disappears. This convergence signals a market regime that demands enhanced risk management rather than directional trend-following strategies.