
A composite risk score, built from AI signals, gives you three moves: triage, investigate, or escalate. That single number, backed by a confidence band and a visible data trail, replaces the gut-feel memo most desks still write before a sector call. Run it on one holding or one sector in under 15 minutes:
- Calculate a composite score from your weighted checklist categories.
- Check data provenance and freshness before you trust any single signal.
- Run a scenario stress test against at least one tail case, similar to what StressGen documents.
- Flag anything scoring above your "elevated" threshold for a second reviewer.
Pull a name you're already watching, score it against the template below using something like OnTheRice GeneralSignals, and see where it lands relative to a benchmark such as the VIX.
Key Takeaways
A weighted composite score with an attached confidence band turns scattered risk signals into one auditable number a committee can act on.
| Point | Details |
|---|---|
| Score in bands, not raw numbers | Use score bands to trigger consistent actions. |
| Confidence matters as much as the score | Track ensemble disagreement and conformal interval width alongside the headline number. |
| Regime awareness prevents false comfort | Treat identical confidence scores differently in calm versus volatile markets. |
| Assign clear ownership | Give a named owner, data steward, and escalation sign-off to the scoring process. |
| Ontherice maps directly to each step | GeneralSignals, RankingsGeneratorEngine, and RankingHistory cover sourcing, scoring, and audit trail. |
Table of Contents
- The investment risk checklist, item by item
- How do you turn checklist items into one risk score?
- What AI-specific risks does this checklist miss?
- Who should run the checklist and how often?
- What should you monitor after the investment goes live?
- A copyable template for your own checklist
- How does OnTheRice map onto each checklist item?
- How I actually use this checklist day to day
- Put this checklist to work on OnTheRice
- Frequently asked questions
- Sources
The investment risk checklist, item by item
A proper investment risk assessment isn't a single number pulled from a dashboard. It's a stack of checks, each with its own metric, each capable of being wrong in its own way. The industry term for this discipline is financial risk evaluation, and the checklist below breaks it into the pieces that actually move a decision.
Data provenance and quality. Before trusting any signal, check where it came from and how complete the trail is.
- Lineage completeness: a measure of how many data points have a traceable source.
- Freshness: how recent the last update on each feed is, measured qualitatively.
- Coverage: the portion of your investable universe the signal effectively covers.
- Noise: the stability of the signal or its tendency for false positives over recent readings.
Signal confidence and scoring. Every AI-generated score needs an uncertainty measure attached, not just a headline number.
- Model confidence: calibrated probability outputs should be used instead of raw scores.
- Ensemble disagreement: the degree of agreement or disagreement among independent models on a call.
- Conformal interval width: the size of the prediction intervals at a given confidence level, indicating ambiguity as detailed in CVA-SACS's approach to time series to non-exchangeable data.
Scenario and stress testing. Pull specific shock scenarios, not vague "what if" thinking. A six-layer scenario pipeline that blends market context, statistical propagation, and historical analogues, the approach StressGen uses, produces a documented likelihood score with confidence bands rather than a single guessed number.
Liquidity and exit risk. Check average daily volume against your position size, and widen that check during known illiquid windows (holidays, earnings blackouts, month-end rebalancing).
Concentration and correlation. Map exposure against your existing book. A signal that looks strong in isolation often sits inside a cluster you're already overweight.
Regulatory and policy risk. Track pending legislation, sanctions exposure, and sector-specific rule changes using news sentiment and policy-tracking feeds.
Operational and counterparty risk. Check settlement mechanics, custody arrangements, and execution venue reliability, especially for newer or thinly-traded instruments.
Macro tail drivers. Yield curve shape, credit spreads, and volatility surface skew all move faster than most quarterly reviews catch.
Pro Tip: Compare conformal prediction set sizes across market regimes, not just across assets. A model that stays tight in calm markets but balloons its interval during volatility is telling you something a point estimate never will.
How do you turn checklist items into one risk score?
You weight each category, score it, multiply, and sum. It sounds crude because it is, deliberately, so an analyst who didn't build the model can still audit it in thirty seconds.
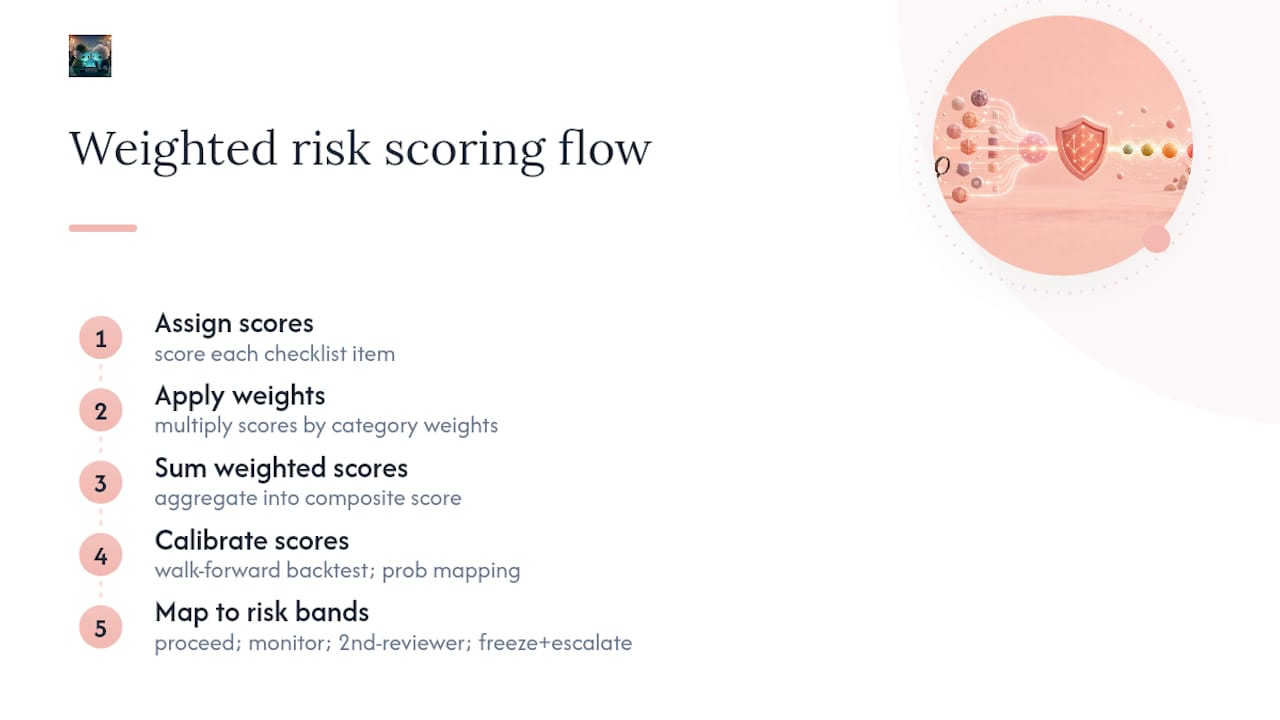
Score bands translate the number into actions: scores in the low range represent low risk and proceeding as planned; medium range calls for standard monitoring; elevated scores require a second reviewer before increasing exposure; highest scores indicate crisis conditions, prompting freezing new exposure and escalating.
For calibration, walk-forward backtesting beats a single historical fit, and an isotonic calibration layer or logistic meta-learner converts raw model scores into honest probabilities, a method CVA-SACS applies on top of its ensemble output. A worked example: given example scores for each category weighted accordingly result in a composite score that falls within the medium risk band, indicating standard monitoring is appropriate rather than a full committee review.
What AI-specific risks does this checklist miss?
Standard risk frameworks weren't built for model failure modes. A checklist that only tracks market risk misses the ways the model itself can lie to you.
- Data drift: the distribution feeding your model today no longer resembles what it was trained on. Mitigate with scheduled retraining triggers, not fixed calendar dates.
- Overconfidence in regime shifts: models trained mostly on calm markets often stay falsely confident heading into a shock. Regime-aware confidence scaling, built into ensembles like CVA-SACS, addresses this directly.
- Ensemble disagreement ignored: if three models disagree and you only look at the average, you've thrown away the most useful information in the system.
- Missing explainability: a score with no SHAP attribution or feature waterfall attached is a black box you can't defend to a committee.
Pro Tip: Treat identical confidence scores differently depending on the regime. A 90% confidence reading during low-volatility conditions and the same 90% during a liquidity crunch are not the same claim.
Who should run the checklist and how often?
Assign it like any control function, not an ad hoc task someone remembers when markets wobble.
- Owner: sets thresholds and owns the composite scoring logic.
- Data steward: monitors provenance and freshness across every feed.
- Quant reviewer: checks calibration and flags ensemble disagreement.
- Business reviewer: interprets the score against the actual investment thesis.
- Escalation owner: signs off once a score crosses the elevated threshold.
| Cadence | Activity |
|---|---|
| Daily | Automated composite scoring on active positions |
| Weekly | Human review of anything in the elevated band |
| Monthly | Recalibration of weights and confidence models |
| Event-driven | Full scenario stress test on regime change or shock |
The escalation runbook stays simple: a score above 80 triggers executive escalation plus an immediate freeze or hedge decision. Wire the checklist into pre-trade sign-off, committee agendas, and portfolio monitoring dashboards so it isn't a separate exercise nobody checks. A strategic decision-making checklist built for governance more broadly pairs well here.
What should you monitor after the investment goes live?
The checklist doesn't end at the buy decision. Track the composite score, ensemble disagreement, liquidity depth, realised volatility, and stress scenario P&L impact on a rolling basis.

| KPI | Frequency | Alert threshold |
|---|---|---|
| Composite risk score | Daily | + |
| Model disagreement index | Daily | > threshold across ensemble |
| Liquidity depth | Weekly | Below average volume |
| Stress scenario P&L impact | Monthly | Exceeds pre-set loss limit |
A useful alert message states the metric, the threshold breached, and the exact runbook step, no more.
A copyable template for your own checklist
Paste this structure straight into a spreadsheet or a BI dashboard: item, metric, raw value, normalised score, weight, weighted score, notes, provenance link, last updated.
Import into Google Sheets with a simple paste, or feed it into a BI tool via CSV export for teams already running automated dashboards.
How does OnTheRice map onto each checklist item?
Every category above needs a data source and an audit trail behind it. That's the gap OnTheRice GeneralSignals fills first, live signal feeds with provenance attached so the data quality section of your checklist has something concrete to check.
OnTheRice RankingsGeneratorEngine turns raw signals into a ranked composite score, the same aggregation logic the scoring methodology above describes. OnTheRice AiTools gives teams the integration layer to pull signals into their own scoring templates rather than working inside a locked dashboard. For spotting where a sector's fundamentals diverge from its price action, similar to how AlphaDrift separates macro outlook from momentum, OnTheRice AIOpportunities surfaces that divergence directly.
For the audit trail your escalation owner will eventually ask for, OnTheRice RankingHistory and Leaderboard hold the historical track record, calibration evidence, and confidence bands behind every score. A team scoring a single sector would move through GeneralSignals for raw data, RankingsGeneratorEngine for the composite number, then RankingHistory to check how that ranking has moved and whether it's held up.
Pro Tip: Pull the provenance link on every signal you use in a committee memo. If you can't trace a number back to its source in one click, don't put it in the deck.
How I actually use this checklist day to day
I run the composite score weekly on active watchlist names, and anything crossing the elevated band gets a second set of eyes before it reaches a committee memo. Two things I've learned the hard way: during a regime shift, watch ensemble disagreement before the composite score even moves, it tends to widen first. And when signals conflict, investigate the divergence itself rather than averaging it away.
Put this checklist to work on OnTheRice
Running this checklist by hand across a watchlist of thirty names eats an afternoon. Ontherice compresses that into a live scoring workflow: pull signals, generate the composite ranking, and check the historical track record without rebuilding your spreadsheet each week. Start at OnTheRice AIOpportunities to see sector-level divergence scoring in action, or head to OnTheRice AiTools if your team wants to pull raw signals into an existing model.
The core signal feeds and ranking history are free to explore. Deeper features, advanced calibration views, premium signal cards, extended history, unlock through Access Points, so you only pay for the depth you actually need. Create a free account and score your first sector against GeneralSignals today.
Frequently asked questions
What is an investment risk checklist used for? It gives professionals a structured way to score an investment, sector, or emerging trend across data quality, signal confidence, liquidity, concentration, and macro exposure before committing capital.
What are the main types of investment risk to check? Market risk, credit risk, liquidity risk, and inflation risk sit alongside AI-specific risks like model overconfidence and data drift, which older checklists rarely cover.
How often should you run a risk assessment on active positions? Daily automated scoring with weekly human review of anything in the elevated band keeps pace with fast-moving signals without overwhelming reviewers.
Can AI signals replace human judgement in risk management strategies? No. AI signals surface patterns and calculate composite scores faster than manual review, but a human reviewer still interprets the score against the actual investment thesis before any final call.
What makes a good checklist for investors different from a generic template? A good checklist for investors ties each item to a measurable metric, freshness, coverage, confidence, rather than a vague yes or no box, so the output can feed directly into a composite score.
This article is general information, not a substitute for advice from a qualified financial advisor. Consult a qualified financial professional about your own circumstances before acting on anything here.
Sources
- AI-Augmented Financial Stress Testing & Market Risk Manager | StressGen
- AI stock analysis tool — how AlphaDrift works