
Cross-sector trend analysis is the practice of tracking signals across multiple industries at once to find where developments in one domain, such as AI, will accelerate or strain another, such as energy or logistics. It matters in 2026 because AI has become a systemic enabler that touches almost every sector simultaneously, while compute and energy constraints now act as bottlenecks that ripple across industries no single-sector forecast can see coming. Done properly, it gives you an early warning system rather than a rear-view mirror.
TL;DR:
- Cross-sector trend analysis reveals how AI acts as a connective force impacting multiple industries simultaneously, emphasizing the importance of monitoring interdependencies.
- Physical constraints like energy and compute demand from AI infrastructure are creating bottlenecks that require collaboration between hyperscalers, utilities, and regulators.
- A hybrid human–AI pipeline improves trend detection accuracy by combining automated extraction and clustering with expert validation and reproducible cataloging.
- Monitoring cross-industry signals in energy, healthcare, and sustainability sectors can produce early warnings for significant shifts often missed by single-sector analysis.
- Organizational readiness, including ongoing monitoring and cross-department collaboration, is crucial to act effectively on cross-sector trends rather than relying on episodic reports.
Table of Contents
- What is cross-sector trend analysis and why does it matter?
- Core methodologies and frameworks used in cross-sector analysis
- Step-by-step hybrid pipeline teams can adopt
- Representative use cases and sector intersections
- Common pitfalls, governance and change-readiness
- OnTheRice's perspective on cross-sector trend work
- How OnTheRice turns this analysis into a working signal feed
- Sources
What is cross-sector trend analysis and why does it matter?
Most trend research still works the way it did a decade ago: an analyst picks a sector, reads the reports for that sector, and produces a forecast about that sector. That approach misses the interesting part. The signals that move markets today rarely stay inside their lane.
Cross-sector trend analysis instead tracks meta-trends, forces that show up across many industries at once and reveal friction or acceleration where they meet. A shortage of high-voltage transformers, for instance, sounds like a utilities story until you realise it is throttling the pace at which data centres for AI training can be built. That is not a sector story. It is an interdependency story, and it needs a different lens.
The standard organising tool for this is PESTEL, which breaks the operating environment into Political, Economic, Social, Technological, Environmental and Legal factors. Cross-sector work uses PESTEL differently from single-sector planning: instead of scoring each factor in isolation, analysts look for where the same technological shift (say, generative AI adoption) produces different economic and legal consequences depending on which industry absorbs it. Industry foresight work frames the current period as a NAVI world, Non-linear, Ambiguous, Volatile, Interconnected, where forces from one PESTEL category regularly spill into another and single-point forecasts stop being useful, as EY's megatrends framing argues.
The evidence for why this matters now is fairly stark. Meta-trend research synthesising a large number of sources across multiple sectors has found that AI accounts for several of the highest-impact trends currently surfacing in global knowledge graphs, according to a cross-sector trend analysis overview published in MDPI. That is not AI as one trend among many. It is AI as the connective tissue running through nearly all of them, which is exactly why treating it as a single-sector "tech trend" undersells what is happening.
There is a second, less obvious driver: physical constraint. KPMG's 2026 frontiers report points out that compute and energy demand from AI infrastructure now forces collaboration between hyperscale technology firms, utilities, and regulators that previously had almost nothing to do with each other. When a chipmaker's roadmap depends on a grid operator's substation timeline, sector-bound analysis simply cannot see the risk coming.
What this means practically for a strategist or analyst:
- A trend that looks minor within its own sector can be the leading indicator for a much bigger shift somewhere else entirely.
- Waiting for a trend to appear in your own sector's trade press often means you are already twelve to eighteen months behind.
- The organisations gaining advantage from cross industry trends right now are the ones building monitoring systems that deliberately cross domain boundaries, not the ones with the deepest single-sector expertise.
Core methodologies and frameworks used in cross-sector analysis
Three frameworks do most of the heavy lifting in serious cross-sector work, and they are not interchangeable. Each answers a different question.
PESTEL answers "what kinds of force am I looking for?" It is a sorting mechanism, useful for making sure you are not only watching technology signals while ignoring the legal or environmental ones that will eventually constrain them.
Megatrend mapping answers "which of these forces are big enough and durable enough to matter?" This is where the volume of source material comes in. Genuine meta-trend work synthesises well over 200 sources across 30 or more sectors, according to the MDPI cross-sector overview, because a real cross-cutting trend needs to show up independently in unrelated domains before you can trust it is not noise.
Scenario analysis answers "what do I do about it, given that I cannot know which future arrives?" Rather than producing one forecast, teams build several plausible futures and pressure-test strategic options against each. The EY megatrends framing recommends filtering incoming signals through a small set of enduring primary forces, technology, demographics, sustainability, geopolitics, before running them through scenario planning, precisely because a NAVI environment punishes anyone who bets on a single outcome.
The methodology that ties these together in current practice is a hybrid human–AI pipeline. This is worth explaining properly, because it is the part most organisations get wrong, either by trusting AI outputs uncritically or by ignoring AI tools altogether and drowning in manual research.
The hybrid approach documented in the Defly Compass methodology runs in stages:
- Automated extraction. AI systems scan a large corpus, literature, reports, filings, media, and pull out candidate signals at a scale no human team could match manually.
- Computational clustering. Multi-agent AI and knowledge graphs group related signals and surface non-obvious intersections between domains.
- Expert validation. Domain specialists review the computational output, discard false positives, and confirm which clusters represent genuine cross-cutting trends rather than statistical coincidence.
- Reproducible catalogue. The validated output becomes a documented, auditable trend catalogue rather than a one-off slide deck, so the next team can trace how a conclusion was reached.
That fourth step is the one organisations skip most often, and it is the one that separates analysis you can defend to a board from analysis that is just a confident guess. The Defly Compass research is explicit that this hybrid combination reduces hundreds of preliminary, noisy signals into a validated, high-priority set, and that the reproducibility of the audit trail is itself a governance feature, not a nice-to-have.
Pro Tip: Run the same corpus through your AI extraction step twice, a week apart, before validation. If the candidate signal list barely changes, you have a stable trend. If it shifts wildly, you are probably picking up news noise rather than a durable pattern.
Where teams go wrong is treating AI clustering as the final answer instead of the first draft. The MDPI comparative case studies across agriculture, education and public health found that combining computational tools with expert review consistently surfaced both universal cross-cutting trends, digital infrastructure development, data analytics integration, and domain-specific nuances that pure automation missed entirely. Neither half of the pipeline works well alone.
Step-by-step hybrid pipeline teams can adopt
A reproducible process matters more than a clever framework. The pipeline below reflects the phased approach validated in the Defly Compass methodology and can be adapted by a team of almost any size.
-
Define scope and assemble the corpus. Decide which sectors are in scope and, just as importantly, which sources are excluded. A common mistake here is corpus creep, adding "just one more" source category until the signal-to-noise ratio collapses. Set exclusion rules upfront: outdated sources beyond a fixed date range, promotional material without underlying data, single-source claims with no corroboration.
-
Run automated signal extraction and clustering. AI tools process the corpus to identify candidate signals and group them using knowledge graphs and co-occurrence analysis. The output at this stage is deliberately over-inclusive. You want noise here; filtering happens next.
-
Apply cross-domain validation and scoring. Domain experts from each sector represented in the corpus review the clustered signals. This is where a co-occurrence matrix becomes a trend matrix: signals get scored on momentum and impact, and cross-sector intersections get flagged for closer inspection. Anything that only one expert panel recognises but that shows strong cross-domain co-occurrence deserves particular scrutiny, since that gap is often where the real edge lies.
-
Translate validated signals into scenarios and actions. Take the top-scoring, validated trends and run them through scenario analysis, building two or three plausible futures rather than a single forecast, then identify "no-regret" moves that make sense regardless of which scenario materialises. Set a monitoring cadence (quarterly is typical for fast-moving domains like AI infrastructure) so the catalogue stays current rather than becoming a one-time report gathering dust.
Pro Tip: Assign a named owner to each validated trend before you move to the monitoring phase. A trend with no owner never gets re-checked, and stale trend catalogues are how organisations end up acting on last year's signal.
Governance checkpoints matter throughout, not just at the end. Expert validation in phase three should involve people from outside the sector generating the signal wherever possible, since in-sector experts are the ones most likely to miss an external disruption because it does not fit their existing mental model. Keeping an audit trail of why each signal was included, scored, or discarded is what makes the catalogue defensible later, and it is the feature that separates a genuine cross-sector trend mapping process from a one-off consulting deck nobody can interrogate six months on.
Teams that treat this as episodic work, a report produced once a year, consistently underperform teams that treat it as infrastructure. The difference shows up most clearly in phase four: without a monitoring cadence and assigned ownership, even a well-validated trend catalogue degrades into another PDF nobody revisits.
Representative use cases and sector intersections
Abstract frameworks earn their keep only when you can point to where they actually change a decision. Three intersections stand out in current foresight work.
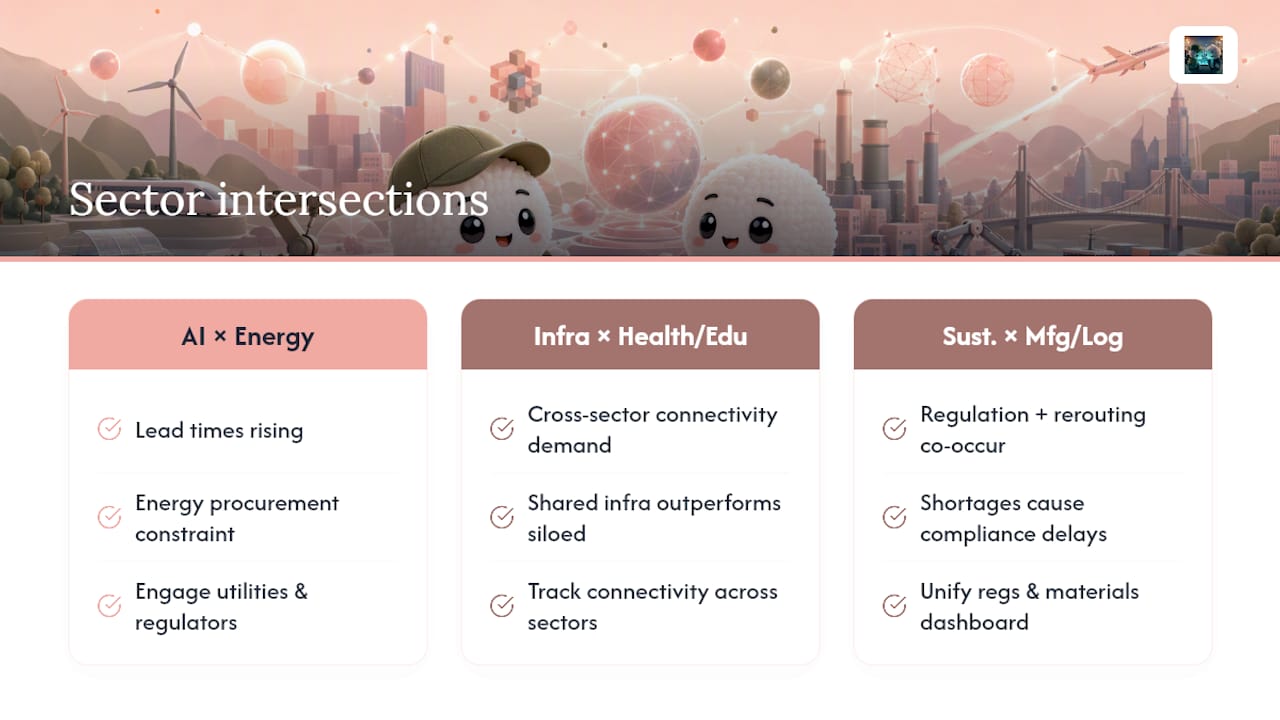
AI × energy. Rising compute demand from AI training and inference is not a technology story alone; it is now a grid-capacity story. Signal: transformer and substation lead times lengthening in regions with concentrated data centre construction. Business implication: any company planning AI infrastructure investment on a two-year horizon needs to treat energy procurement timelines as a hard constraint, not a footnote. Suggested action: build utility and regulator relationships into the capital planning process well before the site selection stage, exactly the kind of collaboration the KPMG frontiers report flags as increasingly necessary between hyperscalers and utilities.
Digital infrastructure × healthcare and education. Connectivity is increasingly treated as foundational infrastructure rather than a discretionary upgrade in both sectors. Signal: comparative case studies across education and public health found digital infrastructure development and data analytics integration surfacing as universal cross-cutting themes, per the MDPI comparative case study research. Business implication: vendors and policymakers planning connectivity rollouts in one sector should expect parallel demand from the other, meaning shared infrastructure investment can outperform siloed spending. Suggested action: track connectivity signals across both domains together rather than commissioning separate sector reports that miss the shared dependency.
Sustainability × manufacturing and logistics. Material scarcity, tightening environmental regulation, and supply chain disruption increasingly compound each other rather than arriving as isolated pressures. Signal: co-occurrence between regulatory tightening language and supply chain rerouting terms rising together in filings and trade press. Business implication: a materials shortage that looks like a procurement problem is often also a compliance-timeline problem, and treating them separately means discovering the conflict too late. Suggested action: build regulatory and materials-availability tracking into a single dashboard rather than two departmental reports that never talk to each other.
Each of these follows the same shape worth internalising: a signal that looks routine inside one sector's reporting, a business implication that only becomes visible once you connect it to a second sector, and an action that has to happen before the connection becomes obvious to competitors. The benefits of cross-sector trend monitoring compound specifically because most organisations are still only watching the first sector.
Common pitfalls, governance and change-readiness
The most common failure mode is not bad analysis. It is uneven readiness, where the trend catalogue is solid but the organisation cannot act on it because different departments move at different speeds. Guidehouse's 2026 trends guide highlights partnerships forming without playbooks and talent pipelines that cannot keep pace with what the signals demand, which turns a good forecast into a shelved document.
Other pitfalls show up in recognisable patterns:
- Noisy signals get mistaken for genuine trends when hype scoring is not paired with an impact measure.
- In-sector experts unconsciously discount signals that threaten their own department's current strategy.
- Trend catalogues built once and never revisited become confidently wrong within a year in fast-moving domains.
- Automated extraction without human review over-weights whatever is loudest in the media that quarter.
Governance safeguards worth building in from day one include a standing cross-domain expert panel (not assembled ad hoc per project), a documented audit trail for every included and excluded signal, and transparency about how scores were assigned so a sceptical stakeholder can trace the reasoning rather than take it on faith.
Pro Tip: If your validation panel agrees unanimously on every signal, that is itself a warning sign. Genuine cross-sector trends should generate some disagreement between domain experts, because the whole point is that no single expert has full visibility.
The organisations that handle this well embed continuous monitoring with a fixed cadence and identify no-regret moves early: investments that make sense across every plausible scenario, so teams can act before uncertainty resolves rather than waiting for perfect clarity that never arrives.
OnTheRice's perspective on cross-sector trend work
The uncomfortable truth in this field is that most "trend reports" are single-sector research wearing a cross-sector label. Ontherice was built around the opposite premise: that a hybrid AI and human validation process, applied continuously rather than as an annual event, is the only way to keep pace with how fast AI-driven signals now move between industries. Our ranking methodology stays transparent for exactly this reason, so users can see how a score was reached rather than trusting a black box.
None of this replaces domain judgement. It is designed to feed it faster, with less noise, so that the people making strategic calls spend their time validating signals rather than hunting for them across scattered reports and disconnected sector silos.
— Aidil
How OnTheRice turns this analysis into a working signal feed
Reading about Business Strategy and Project Management Services is one thing. Running it continuously, across dozens of sectors, without a research team, is another problem entirely, and it is the one Ontherice was built to solve. Rather than commissioning a fresh trend report every quarter, you get a live feed built on the same hybrid principle described above: AI-driven extraction paired with transparent scoring, updated continuously instead of once a year.

For teams that need continuous, curated monitoring across borders and industries, the SignalsInternational feed delivers cross-sector signals and sector rankings without requiring an in-house analyst team to build the pipeline described in this guide from scratch. If you want a lighter starting point before committing to a full feed, GeneralSignals offers broad monitoring across industries as a medium-entry option. And if your team wants to build its own reproducible scoring rubric rather than rely on a pre-built index, the RankingsGeneratorEngine generates transparent, custom rankings across sectors using the same trend-matrix logic covered earlier in this piece.
Whichever entry point fits, the practical next step is the same: open a live signals feed, ask it a direct question about the intersection you are watching, and see whether the AI-validated score matches what your own analysis suggests. That comparison alone is often the fastest way to test whether your current process is catching what matters.
Sources
The quality of any cross-sector market trends output depends entirely on what goes into it before the AI ever touches it. Weak inputs produce confident-sounding nonsense.
Reliable practice draws on a mix of source types:
- Defly Compass trend analysis methodology (Information, 2025)
- MDPI - Cross-sector trend analysis overview
- KPMG frontiers report 2026
- EY - Megatrends 2026
That last point about financial signals deserves more attention than it usually gets. Academic research on forecasting real economic activity using cross-sectoral stock market information found that sectoral financial variables predicted industrial production growth more effectively than aggregate market measures. In other words, watching how capital moves between sectors tells you more about what is about to happen than watching any single sector's headlines.
Once the corpus is assembled, three analytic techniques do most of the actual pattern finding:
Co-occurrence matrices measure how often two concepts, terms, or entities appear together across the corpus. High co-occurrence between "battery storage" and "grid regulation," for example, flags an interdependency worth investigating even if no single article connects them explicitly.
Knowledge graphs turn those co-occurrence relationships into a navigable network, letting analysts trace how a trend in one node (say, semiconductor export controls) propagates through connected nodes (manufacturing, defence, consumer electronics pricing).
Semantic projection uses language models to place concepts in a shared meaning space, catching relationships that share no common vocabulary at all, useful when two sectors describe the same underlying phenomenon in completely different jargon.
The output of this work usually gets prioritised through something like a Trend Momentum Index, a rubric that scores signals on both hype (media and search volume) and impact (regulatory, financial, operational consequence). Trend-radar practitioners recommend this dual-axis approach specifically because a signal high on hype but low on impact is a fad, while one high on impact but low on hype is exactly the early-stage trend worth acting on before competitors notice, an approach outlined by the InFuture Institute's trend mapping work.
Automated extraction alone tends to over-weight hype, because that is what generates volume in the source material. Human filtering exists specifically to correct for that bias, checking whether a signal with genuine momentum actually has the structural backing, capital, regulation, infrastructure, to matter in eighteen months rather than eighteen days.