
Seven metrics separate a trend ranking you can act on from one you should ignore: precision/hit-rate, lead time, signal-to-noise persistence, sample size with out-of-sample degradation, calibration (Brier score), data freshness, and provenance/transparency. Score every ranking against these before you trust it enough to change a budget, a hire, or a launch date.
A simple composite works better than any single number: weight each signal by its calibration accuracy, cap the weight when sample size is thin, and check that performance holds outside the window it was built on.
- Precision/hit-rate on labelled outcomes
- Median lead time and its spread
- Persistence across rolling windows
- Sample size penalty and in-sample vs out-of-sample gap
- Brier score for calibration
- Freshness at collection, processing, and delivery
- Provenance you can trace back to source
Pro Tip: Before you commit to any ranking, pull the top 20 signals from the last quarter and check two things by hand: did they land ahead of the market consensus, and would you have acted on them at the time?
Key Takeaways
Trustworthy ranking evaluation combines precision, lead time, persistence, calibration, and sample-size discipline into one composite score rather than relying on any single figure.
| Point | Details |
|---|---|
| Use a composite, not one metric | Blend precision, lead time, persistence, and calibration to avoid single-metric blind spots. |
| Penalise thin samples | Apply a cap such as min(1, n/50) so small-n signals cannot dominate a ranking. |
| Track out-of-sample gaps | Compare in-sample and out-of-sample performance to catch overfitting before it costs you. |
| Measure freshness in three stages | Check collection, processing, and delivery latency separately to make staleness auditable. |
| Ontherice offers inspectable calibration | Its ranking history and Brier-weighted scoring let you verify claims rather than accept them. |
Table of Contents
- What do ranking evaluation metrics actually measure?
- How do you actually calculate these metrics week to week?
- Do better rankings actually move your KPIs?
- What goes wrong even with good-looking metrics?
- Ontherice's approach: a concrete, transparent example you can inspect
- Overview of common ranking metrics such as NDCG, MAP, MRR, and Precision@K
- Differences and trade-offs between ranking metrics
- Use cases and scenarios suited for each ranking metric
- Practical examples illustrating metric calculation
- Handling tie scores and incomplete rankings
- Impact of evaluation metric choice on model optimization
- What actually matters when you judge a ranking
- How Ontherice helps you put these metrics into practice
- Sources
What do ranking evaluation metrics actually measure?
Ranking evaluation metrics answer one question for a market-intelligence product: can you trust this list enough to act on it? That is a different exercise from the academic ranking metrics used in search and recommender systems, and conflating the two gets product teams into trouble. A trend ranking isn't judged by how well it orders items against a fixed relevance label. It is judged by whether the signals near the top would have made you money, saved you time, or steered you away from a bad call, and whether they did that early enough to matter.
Precision, or hit-rate, is the share of top-ranked signals that resolved the way the ranking implied. If a platform surfaces emerging signals regularly and a substantial share turn into real market movements within a defined window, that indicates high precision. Track this on a rolling basis, not as a lifetime average, because a single lucky quarter hides drift.
Lead time measures how far ahead of general awareness the signal arrived. A ranking with 60% precision and a three-week median lead time can beat one with 80% precision and two days' lead time, because the whole point of early signal detection is enabling a decision before your competitors make it. Report lead time as a distribution, not an average. A median of ten days hiding a range of one to sixty days tells you the ranking is inconsistent, not reliable.
Signal-to-noise ratio and persistence describe whether a signal holds up across multiple rolling windows rather than spiking once and fading. Ranking systems that blend median efficiency ratio with a persistence fraction across rolling windows produce noticeably more stable output than ones judged on a single snapshot, because a median resists the one-off regime shock that skews a mean.
- Aim for persistence above a moderate majority across multiple rolling windows before treating a signal as durable
- Use median, not mean, when averaging across windows
- Flag signals with very small sample sizes for a sample-size penalty
Calibration, measured with a Brier score, checks whether a signal's stated confidence matches its actual hit rate. A Brier score under 0.25 on binary outcomes indicates the ranking's probabilities are meaningfully better than a coin flip; scores near 0.5 mean the confidence numbers are decorative. Sample size matters just as much: a signal built on 12 data points can look spectacular in-sample and collapse the moment you test it out-of-sample, so tracking that in-sample-to-out-of-sample gap is non-negotiable.
How do you actually calculate these metrics week to week?
Turning the seven metrics into a working process means building three things: a measurement recipe, a reporting cadence, and a weighting scheme that automatically discounts thin evidence.
- Precision and lead time: label each surfaced signal against a resolved outcome (did the trend materialise within your defined window?) and log the gap between surfacing date and mainstream recognition date. Recalculate both on a rolling 90-day window.
- Persistence: split your history into overlapping rolling windows (say, four weeks each) and record the fraction where the signal's strength stayed above your threshold. A signal persistent in 3 of 4 windows earns more trust than one that spiked once.
- Brier score and OOS degradation: fit the calibration on an in-sample period, then test it against a genuinely held-out period. Track the gap between in-sample and out-of-sample scores as your degradation metric.
- Weighting: apply a sample-size cap that reduces weight when sample size is small to avoid overconfidence regardless of raw score strength, a design choice that deliberately admits ignorance when evidence is thin.
Cadence matters as much as method. Run precision and lead-time monitors weekly, recompute persistence monthly, and reserve full calibration reweighting for a quarterly cycle so you're not chasing noise.
Pro Tip: Build one dashboard with four panels: a precision trend line, a lead-time distribution histogram, a freshness gauge showing collection-to-delivery latency, and an alert rule that fires when out-of-sample degradation exceeds 15 percentage points.

Freshness deserves its own alert. Measuring latency at collection, processing, and delivery separately turns a vague complaint about "slow data" into a specific, fixable bottleneck, with under two days a reasonable target for standard signals and notably faster targets for high-priority signals.
Do better rankings actually move your KPIs?
A ranking evaluation only earns its keep when you can trace it to a business number. Map each metric to a concrete KPI before you present it internally: higher precision should show up as a higher conversion rate on the actions you take from a signal; longer lead time should show up as faster time-to-decision or lower procurement cost from moving before a price shift.
- Precision gain → conversion rate on acted-upon signals
- Lead time gain → days saved in decision cycle or cost avoided by early positioning
- Persistence gain → fewer reversed decisions per quarter
- Calibration gain → tighter, more trustworthy confidence bands for capital allocation
Run pilots as canary tests rather than full rollouts. Take a subset of signals, act on half based on the new ranking and hold the other half as a control, then compare outcomes over a fixed window. A structured live pilot with labelled test cases surfaces false positives faster than waiting for a full quarter's results to land.
A rough return calculation helps set the scaling gate: expected value equals precision multiplied by average deal value multiplied by conversion uplift, minus the cost per alert you're paying to generate it. If that number stays positive across two consecutive pilot windows, promote the signal to production. If not, it stays in testing regardless of how compelling the individual case studies look.
What goes wrong even with good-looking metrics?
The most common failure is optimising for signals that look statistically strong but never translate into a decision anyone actually makes; strategy teams increasingly treat actionability as the real success criterion, not novelty.
- Overfitting: a ranking that looks brilliant in-sample and mediocre out-of-sample was tuned to its own history. Require a genuine walk-forward test before trusting it.
- Staleness disguised as insight: a signal that took nine days to move from collection to your dashboard isn't early, however sharp its precision looks on paper.
- Anti-predictive signals: some indicators consistently point the wrong way during regime shifts. Floor or exclude these rather than let them quietly drag down a composite score.
- Single hard thresholds: a flat cutoff ("only show signals above 80% confidence") ignores calibration. A composite, calibrated score with tunable component thresholds handles volatile periods far better than a one-size-fits-all bar.
Provenance failures deserve particular attention. Trust in AI-generated market analysis depends on traceable sourcing, versioning, and honest backtest practice, including out-of-sample testing that doesn't quietly exclude the awkward cases.
Ontherice's approach: a concrete, transparent example you can inspect
Ontherice builds its rankings from multiple AI engines, and weights each thesis by a Brier-derived calibration score rather than treating every signal as equally trustworthy. A sample-size cap, structured as min(1, n/50), stops a thin dataset from producing an overconfident score.
- Composite calibration blends per-thesis weights into a single probability estimate
- Confidence is reported as a 90% interval, built from bootstrapped variance across theses
- Ranking history and engine documentation are open for inspection, not locked behind a black box
- Users can query the live AI directly to ask why a signal ranks where it does
This is the same discipline described earlier in this article applied to a real product, not a hypothetical framework. If you want to check whether a ranking held up out-of-sample, you can trace it yourself instead of taking a vendor's word for it.
| Point | Details |
|---|---|
| Calibration weighting | Per-thesis scores are weighted by Brier-derived accuracy, not raw confidence |
| Sample-size cap | min(1, n/50) prevents thin data from producing an overconfident ranking |
| Confidence reporting | 90% intervals from bootstrapped variance replace single point estimates |
Overview of common ranking metrics such as NDCG, MAP, MRR, and Precision@K
You may see NDCG, MAP, MRR, and Precision@K referenced when researching ranking evaluation. These come from information retrieval and recommender-system engineering, where the task is ordering search results or product recommendations against fixed relevance labels. They matter to the engineers who build the algorithms behind a platform's ranking engine, but they answer a narrower question than the one a product manager needs answered.
For market-intelligence rankings, the equivalent evaluation stack is the one already outlined here: precision/hit-rate, lead time, persistence, calibration, sample size, freshness, and provenance. These measure whether a signal is actionable and timely, not whether a list is internally ordered in the statistically ideal sequence. A ranking could score well on an IR-style ordering metric while still failing the business test if every signal at the top arrives after the market has already moved.
If your platform's documentation cites NDCG or MRR figures, treat those as engineering quality checks on the underlying model, not as evidence the ranking will help you act early. Ask instead for precision against resolved outcomes, median lead time, and calibration scores. Those figures tell you what you actually need to know before committing budget or headcount based on a ranked list. A vendor confident in its signal quality should be able to hand over both sets of numbers without hesitation.
Differences and trade-offs between ranking metrics
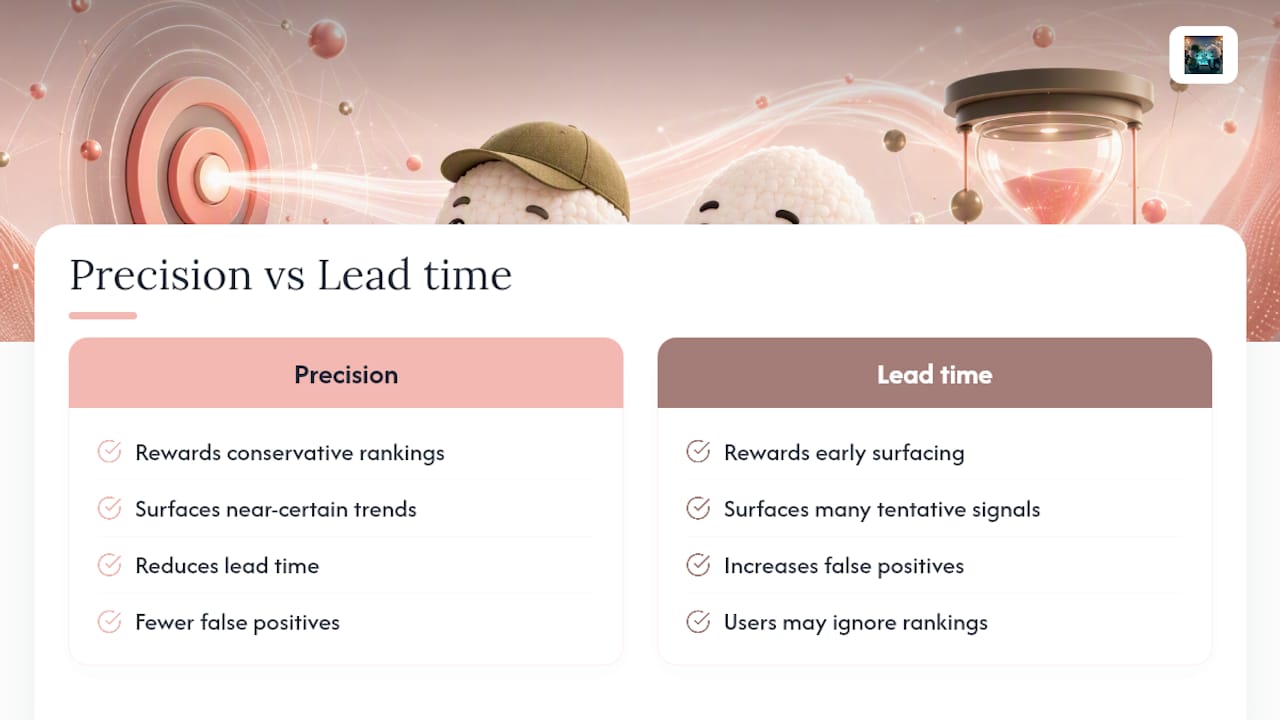
No single metric tells the whole story, and chasing one number in isolation creates blind spots. Precision alone rewards conservative rankings that only surface obvious, near-certain trends, which tends to shrink lead time to almost nothing.
Lead time alone rewards the opposite failure: surfacing everything early regardless of accuracy, which floods a dashboard with false positives and trains users to ignore the ranking altogether. The trade-off between precision and lead time is the central tension in any trend-ranking system, and there is no formula that eliminates it. You choose a point on that curve based on how costly a false positive is for your business versus how costly a missed early signal is.
Persistence and calibration interact differently. A signal can be perfectly calibrated (its stated confidence matches its hit rate) while still being unstable across time windows, which means today's calibration doesn't guarantee tomorrow's. Sample size compounds all of this: a metric that looks excellent on 15 observations carries far less weight than the same metric on 200, even if the raw number is identical. Weighting schemes exist precisely to stop a single strong-looking but thin-data metric from dominating a composite score.
Use cases and scenarios suited for each ranking metric
Different business questions call for leaning on different metrics rather than treating all seven as equally important in every situation.
- Capital allocation decisions: prioritise calibration and Brier score, because a mispriced confidence level directly costs money when you're sizing an investment.
- Competitive positioning and product launches: prioritise lead time, since the entire value of the signal is arriving before rivals notice.
- Recurring operational monitoring (inventory, pricing, hiring signals): prioritise persistence, because a one-off spike shouldn't trigger a permanent process change.
- Vendor or platform selection: prioritise sample size and out-of-sample degradation, because that tells you whether the ranking's track record will hold once you're relying on it.
- Crisis or regime-shift scenarios: prioritise freshness and provenance, because stale or unverifiable data is most dangerous exactly when conditions are moving fastest.
A single dashboard rarely needs all seven metrics surfaced with equal prominence for every user. A strategist scanning for early opportunities cares most about lead time and persistence; a finance lead sizing a position cares most about calibration and sample size. Structuring reporting by role, rather than showing one undifferentiated scorecard to everyone, gets each metric in front of the person who will actually act on it.
Practical examples illustrating metric calculation
Take a concrete case: a platform surfaces 25 signals in a category over a quarter. Of those eighteen, the median gap between surfacing and mainstream recognition is nine days, with a range from two to thirty one days, so lead time is reported as a median value with a wide distribution rather than a single average, to better reflect consistency.
For persistence, split the quarter into four overlapping three-week windows and check whether the same eighteen signals stayed above the strength threshold in each window.
For calibration, compare the platform's stated confidence against actual outcomes across a larger pool, say 200 historical signals. If 70%-confidence signals only resolved 40% of the time, the Brier score climbs and the ranking is overconfident.
Handling tie scores and incomplete rankings
Tie scores happen more often than most dashboards admit, particularly when two signals share nearly identical strength readings pulled from overlapping data sources. Rather than breaking ties arbitrarily by insertion order or alphabetically, break them using the metric with the most evidence behind it, typically sample size or persistence, since these carry more information than a marginal difference in a single strength score.
Incomplete rankings, where some signals lack a resolved outcome yet (the trend hasn't played out enough to label it a hit or miss), need a different treatment entirely. Excluding them from precision calculations biases the metric toward older, easier-to-resolve signals and hides how the ranking performs on the freshest, most valuable output. The better approach is to report precision separately for resolved and unresolved cohorts, and flag the unresolved percentage explicitly so nobody mistakes a partial result for a complete one.
Missing data within a ranking (a signal with no recorded lead time because the baseline awareness date wasn't captured) should never be silently filled with an average or a zero. Either exclude that observation from the specific metric it's missing for, or mark it as genuinely unknown in the reporting. Quietly imputing values into calibration or persistence calculations is one of the fastest ways to manufacture a false sense of confidence in a ranking that hasn't actually been fully tested.
Impact of evaluation metric choice on model optimization
The metric you choose to optimise for shapes the model's actual behaviour, not just how you report on it afterwards. A ranking engine tuned purely to maximise precision will learn to suppress borderline, early-stage signals, because those are the ones most likely to be wrong. Over time this produces a system that looks accurate but consistently arrives late, which defeats the purpose of a trend-detection platform in the first place.
Conversely, a model tuned purely to maximise lead time will learn to surface weaker, noisier signals earlier, inflating false positives and eroding user trust even as the "average lead time" metric improves. This is why a composite scoring approach, one that folds calibration, persistence, and sample-size penalties into a single weighted score, tends to produce more stable model behaviour than optimising any single metric in isolation. Combining freshness, regime deviation, spread quality, and signal agreement into one gated score is one working example of this principle applied to trading signal design specifically.
Threshold choice matters just as much as metric choice. Tuning composite thresholds per category or per strategy, rather than applying one blanket rule, avoids this clustering effect and keeps the model honest about genuine uncertainty rather than gaming a fixed line.
What actually matters when you judge a ranking
Most vendor pitches lean on academic-sounding rigour, precision figures, backtested win rates, polished dashboards, while quietly avoiding the one question that matters: would this signal have made you act sooner than you otherwise would have? That gap between "statistically impressive" and "commercially useful" is where most ranking evaluations go wrong.
The conventional advice treats accuracy as the finish line. It isn't. Lead time and calibration together tell you far more about whether a ranking deserves your trust than precision alone ever will.
If you take one thing from this, prioritise transparency you can actually verify over confidence you're asked to accept. A platform willing to show you its calibration weights, its sample-size penalties, and its out-of-sample results has nothing to hide. One that only shows you a polished top-ten list is asking for trust it hasn't earned yet.
— Aidil
How Ontherice helps you put these metrics into practice
Reading about calibration weights and sample-size caps is one thing. Checking them against a real ranking history is another, and that's where most platforms fall short: they publish a score, not the working behind it. Ontherice's ranking history, per-thesis weights, and calibration reports are built to be inspected, not just quoted.

If you want to see how a specific sector's signals have actually performed, you can pull the ranking history directly and check precision, lead time, and calibration for yourself rather than taking a vendor's summary at face value. Ontherice also supports a short audit of signal quality for teams weighing whether to reweight a category or expand into a new one, using the same Brier-based approach described throughout this article. For business-facing teams building this into a repeatable pilot process, the B2BSignals feed is the practical starting point. Explore the AI tools behind the rankings and run your own precision check on the signals that matter to your sector this quarter.
Sources
- What frameworks help companies spot market shifts early · Pedowitz Group
- Calibration documentation · glostat (GitHub)
- Signal quality scoring: building a market-aware trade gate · Pro Algo Trading
- How to evaluate signal data platforms in 2026 · Autobound
- Shares